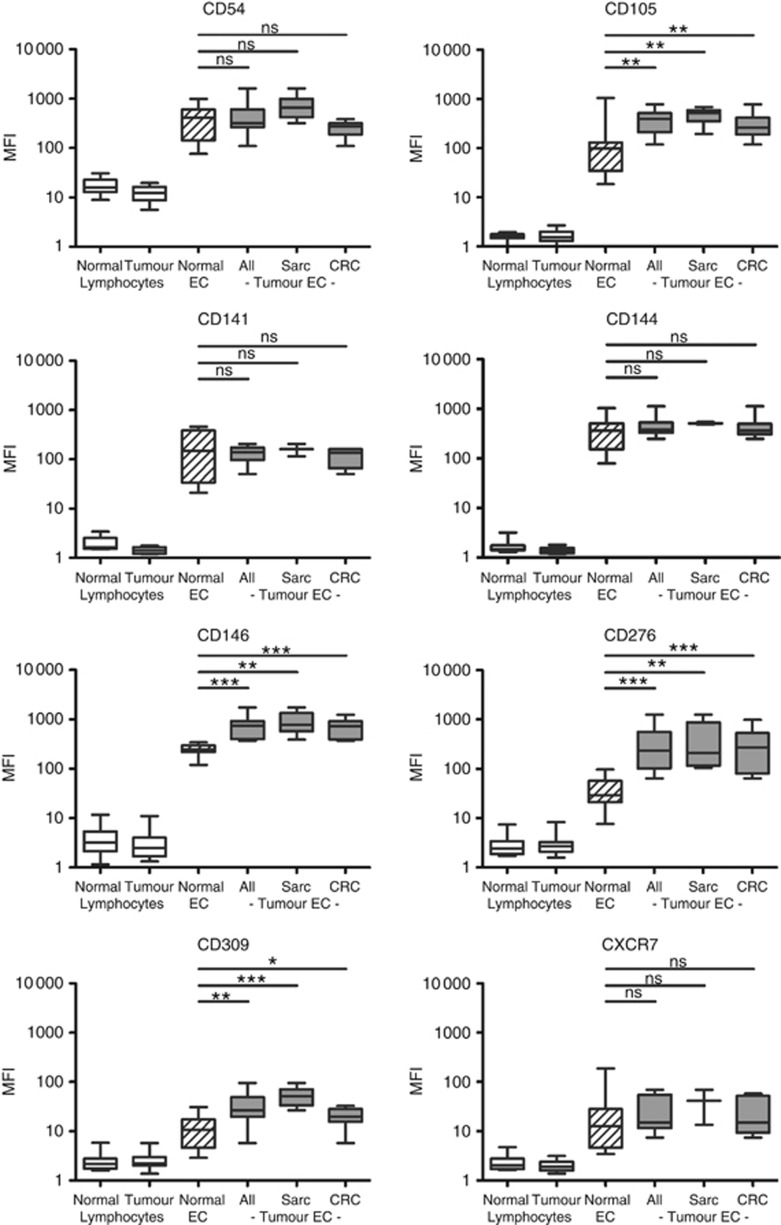
Figure 3.
Antigen expression (mean fluorescence intensity) on lymphocytes (left two bars) and endothelial cells (right four bars) isolated from dissected normal and tumour tissue. Sarcoma (N=6), colorectal cancer (N=11) and all tumours (N=17; sarcoma and colorectal taken together) are separately displayed. Solid lines indicate the median value for each group. P-values: *P<0.05; **P<0.01; ***P<0.001.

