Figure 1.
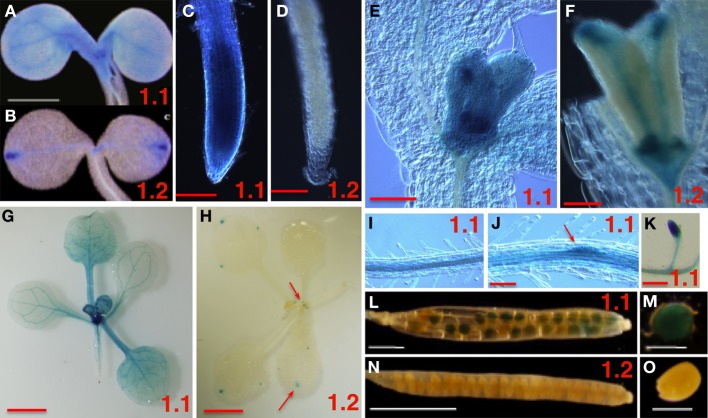
Spatial Expression Patterns of SnRK1.1 and SnRK1.2 Genes. The promoters from SnRK1.1 (1.1 shown in A,C,E,G,I–M) or SnRK1.2 (1.2 shown in B,D,F,H,N,O) were used to drive GUS expression in transgenic plants. (A–F,I,J) are from plants grown on MS agar with no added sugar, and (G,H,L–O) are from soil-grown plants. (A,B) 5 d cotyledons, bar = 1 mm. (C,D) 5 d roots, bar = 100 μM. (E,F) 10 d leaf primordia, bar = 100 μM. (G,H,K) 15 d plants and roots, bar = 2 mm. (I,J) 10 d roots, bar = 100 μM; (L,M) siliques, (N,O) developing seed, bar = 500 μM. The red arrows indicate small areas which are positive for staining.

