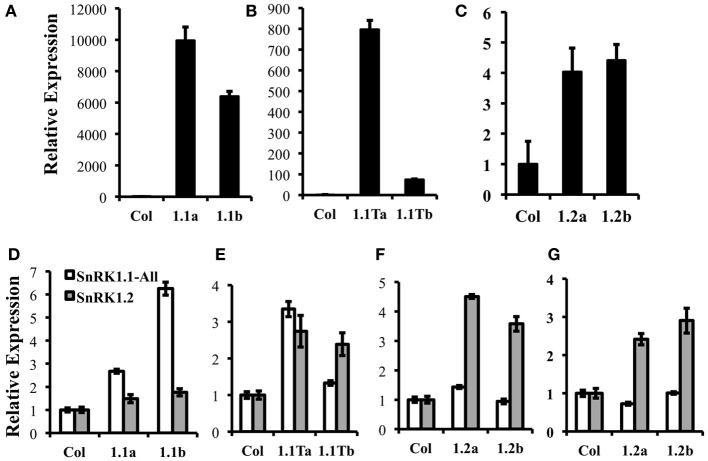
Figure 6.
Expression of Transgenes in SnRK1 transgenic plants. (A–C) Relative levels of GFP expression in 10 d seedlings of wild type (Col), SnRK1.1-GFP, SnRK1.1T-GFP, and SnRK1.2-GFP. (D–G) Relative levels of SnRK1.1 and SnRK1.2 expression in the indicated lines with RNA extracted from (D–F) rosette leaves of 60 d soil-grown plants, and (G) 10 d seedlings. Means of triplicate reactions ± SD are presented. Two or more biological replicates were performed for each.

