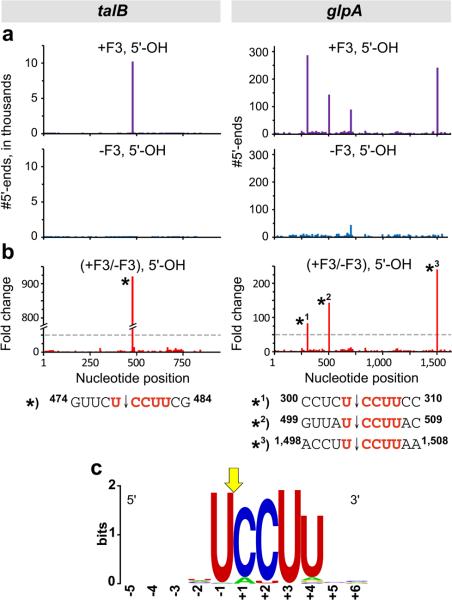
Figure 2. Determination of the MazF-mt3 cleavage recognition sequence by MORE RNA-seq.
(a) Histograms representing the #5’-ends observed in talB (left) and glpA (right) from the analysis of RNAs carrying a 5’-OH isolated from cells containing MazF-mt3 (+F3) or cells without MazF-mt3 (-F3). (b) Histogram representing the ratio of the #5’-ends observed in cells containing MazF-mt3 versus the #5’-ends in cells that did not contain MazF-mt3. The ≥50-fold increase cutoff is marked with a dotted gray line. RNA sequences surrounding the indicated cleavage sites (labeled with an asterisk (*) in the histograms) are shown below. (c) Sequence logo 55 generated by aligning the RNA sequences surrounding the 273 sites for which the #5’-ends with a 5’-OH was ≥50-fold higher in cells containing MazF-mt3 than in cells that did not contain MazF-mt3 (Supplementary Data 1). The numbering reflects the nucleotide position relative to the exact point of cleavage, indicated by the yellow arrow.

