Table 1. Core SAR.

| ||||
|---|---|---|---|---|
|
| ||||
| Cpd | Core | mGlu5 pIC50a (± SEM) |
mGlu5 IC50 (nM) |
% Glu Maxa,b(± SEM) |
| 1 |
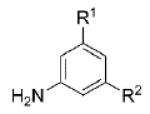
|
6.55 ± 0.19 | 284 | 1.3 ± 0.2 |
| 10 |
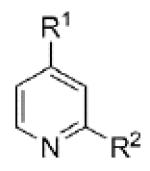
|
6.00 ± 0.21 | 994 | 1.8 ± 0.7 |
| 11 |
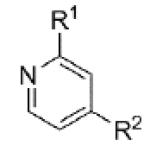
|
5.43 ± 0.26 | 3700 | −4.9 ± 4.7 |
| 12 |
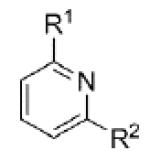
|
6.44 ± 0.19 | 359 | 2.0 ± 0.7 |
| 13 |
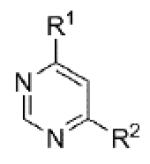
|
5.53 ± 0.23 | 2930 | 1.1 ± 0.5 |
| 20 |
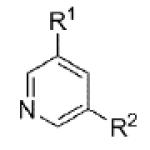
|
6.39 ± 0.07 | 403 | 1.1 ± 0.4 |
| 21 |
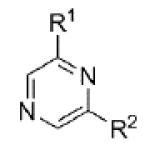
|
6.89 ± 0.04 | 129 | 1.0 ± 0.3 |
| 22 |
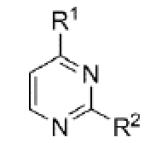
|
<5.0c | >10,000 | 44 ± 8 |
Calcium mobilization mGlu5 assay; values are average of n ≥ 3
Amplitude of response in the presence of 30 μM test compound as a percentage of maximal response (100 μM glutamate); average of n ≥ 3
Concentration response curve (CRC) does not plateau
