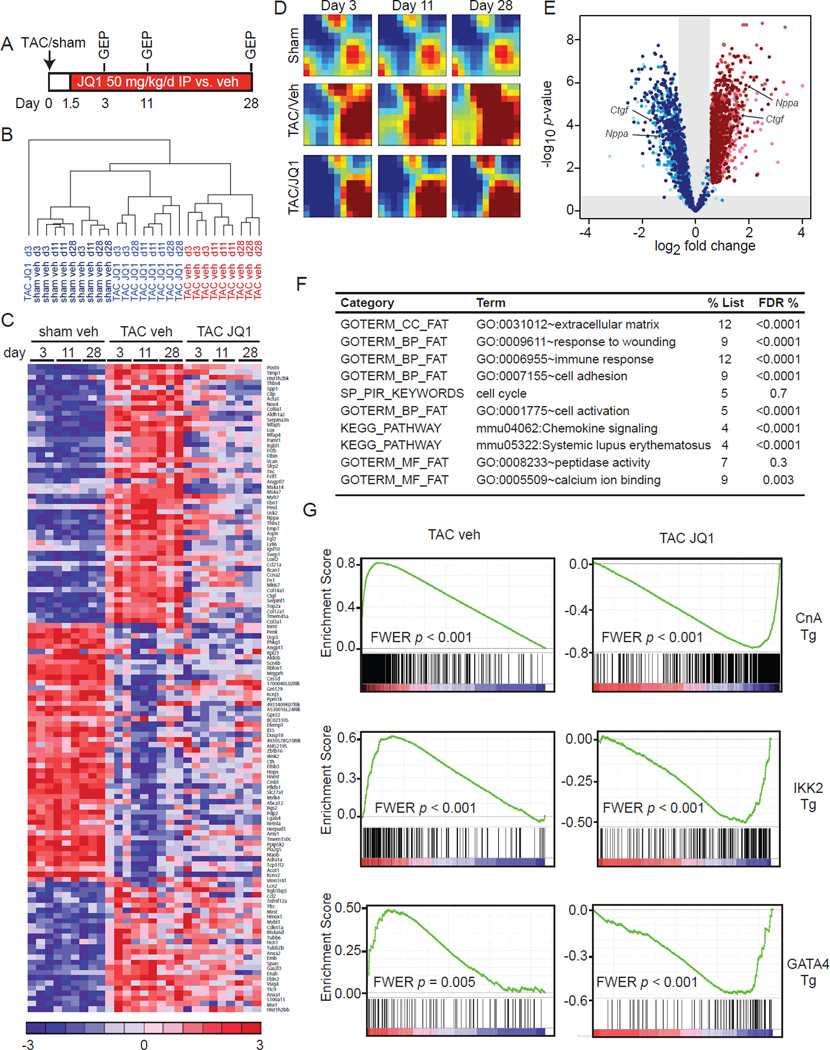
Figure 5. BETs co-activate a broad, but specific transcriptional program in the heart during TAC.
(A) Protocol for GEP experiment. (B) Unsupervised hierarchical clustering of GEPs. (C) Heatmap of selected genes. Full list of DE genes in Table S2. (D) GEDI plots showing temporal evolution of gene clusters. (E) Volcano plot showing fold change effect of TAC+JQ1 vs. TAC-veh (shades of blue) on all genes upregulated at any time-point by TAC-veh vs. sham-veh (shades of red). Progression from lighter to darker shading represents increasing time (3d, 11d, 28d) (F) DAVID analysis of genes that were TAC-induced and JQ1-reversed. FDR <5% considered statistically significant. (G) GSEA for TAC-veh and TAC-JQ1 against three independent GEPs derived from CM-specific activation of canonical pro-hypertrophic transcriptional effectors in vivo: Calcineurin-NFAT (driven by a constitutively active Calcineurin A transgene (Bousette et al., 2010), NFκB driven by an IKK2 trasngene (Maier et al., 2012) and transgenic GATA4 overexpression (Heineke et al., 2007)). FWER p<0.250 represents statistically significant enrichment. Data representative for all three time-points. Plots shown for 28d time-point. Data shown as mean ± SEM. See also Figure S4 and Table S2.

