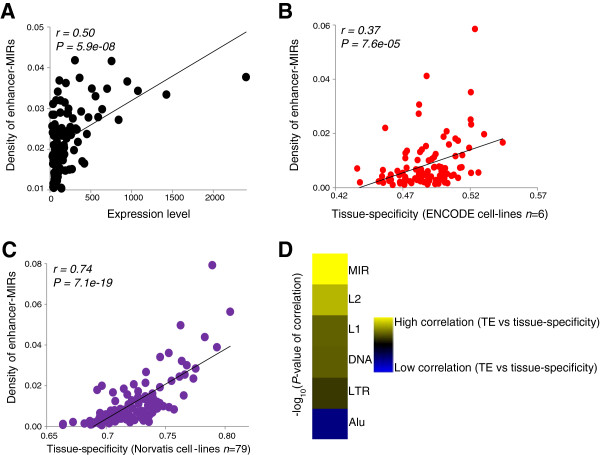
Figure 5.

Effect of enhancer-associated MIRs on gene expression. (A) Relationship between density of enhancer-MIRs and gene expression levels in K562. (B) Relationship between density of K562 enhancer-MIRs and tissue-specificity of gene expression across six ENCODE cell-lines. (C) Relationship between density of K562 enhancer-MIRs and tissue-specificity of gene expression across 79 tissues from the Norvatis Gene Expression Atlas. Pearson correlation coefficient values (r) along with their significance values (P) are shown for all pairwise regressions. (D) Relative strength of correlation between the densities of different TE types around genes and the tissue-specificity of those genes.
