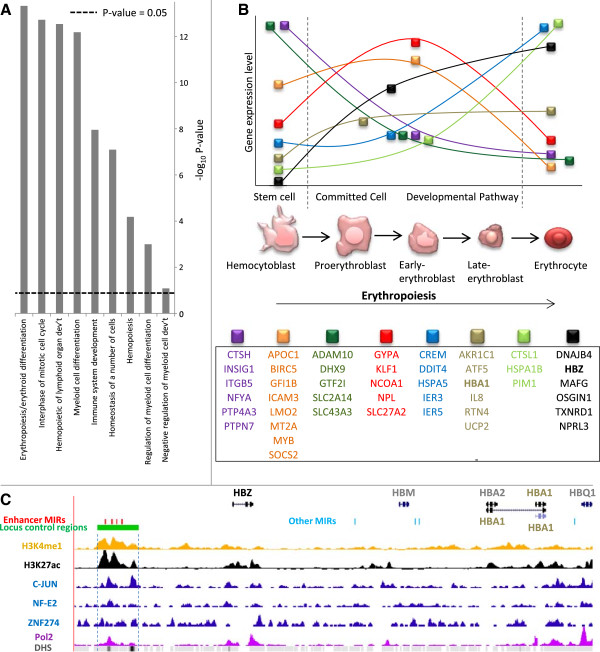
Figure 6.

Functional enrichment of enhancer-associated MIR-linked genes in erythropoiesis. (A) Enrichment levels of enhancer-associated MIR-linked genes within gene sets for erythropoiesis-related biological functions. Statistical significance (P values computed using the hypergeometric test). (B) Enhancer-MIR associated gene sets (colored boxes) that are dynamically expressed across developmental stages of erythropoiesis. (C) Enhancer-associated MIRs (red) in the α-globin gene cluster locus control region (LCR, green). Locations of histone modifications, TF and Pol2 binding, DNase I hypersensitive sites (DHSs) are shown.
