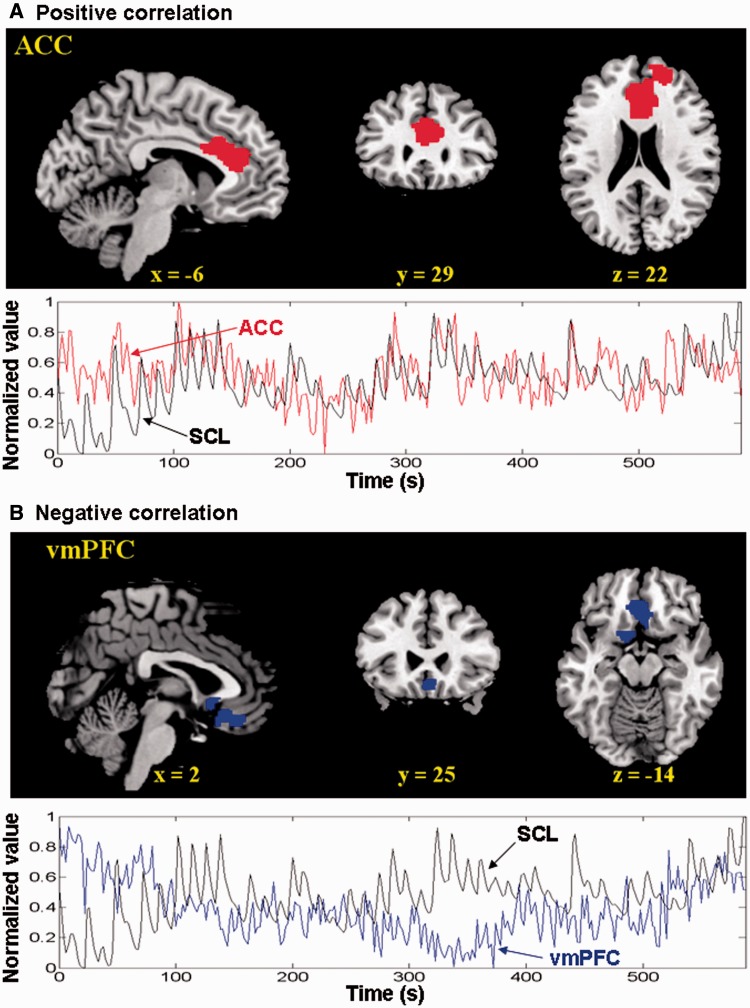
Fig. 1.
Brain regions showed positive (top of A) and negative (top of B) correlations with the SCL across 24 subjects at voxel P < 0.0001 uncorrected and cluster P < 0.05 corrected for FWE of multiple comparisons. (Bottom of A and B) Data from a typical participant show that the time series of the ACC and vmPFC are each correlated and anti-correlated with SCL in a 10 min session.

