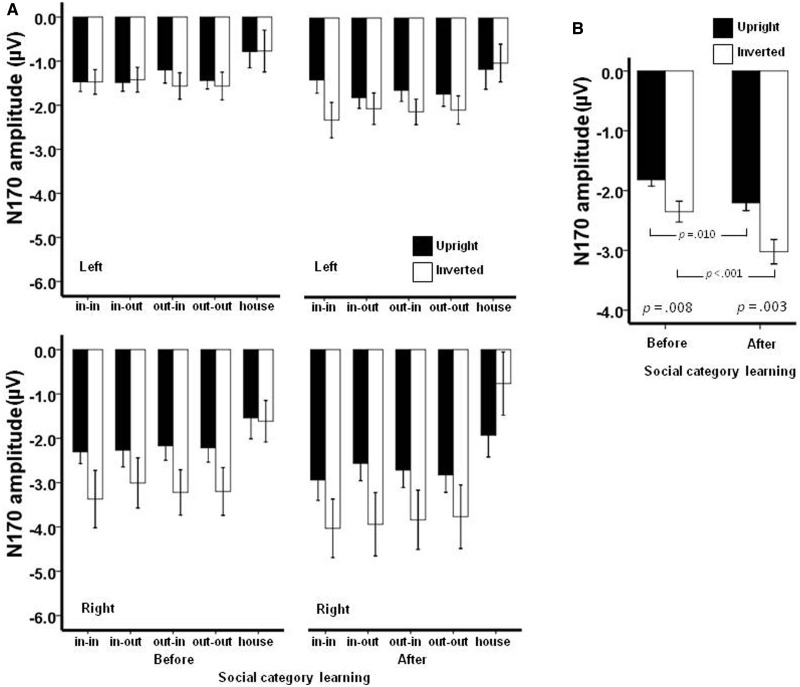
Fig. 4.
The N170 amplitudes (A) for each category of face before and after social category learning, and for houses. The graphs in (B) show that after participants learned the social categories of the face stimuli, the overall N170 amplitude increased, and the FIE was significantly enhanced. Legend: in–in (double in-group; Canadian Brock); in–out (in-/out-group; Canadian non-Brock); out–in (out-/in-group; non-Canadian Brock); out–out (double out-group; non-Canadian non-Brock). Error bars represent the s.e.m.

