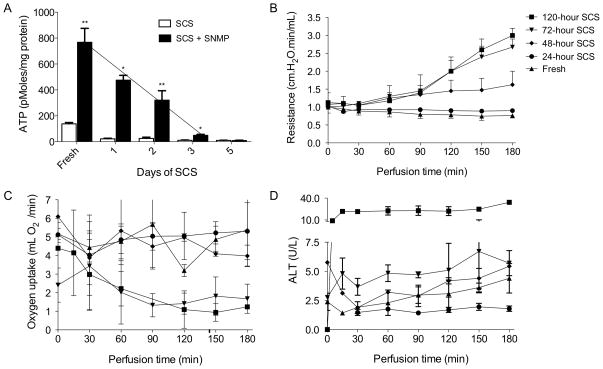
Figure 1. ATP and parameters during SNMP.
ATP content of fresh livers, after static cold storage (SCS; white bars) and after SCS with subnormothermic machine perfusion (SNMP; black bars)(A). Vascular resistance measured during SNMP of livers after SCS and fresh (B). Oxygen uptake rate from perfusate (C) and alanine transaminase release in to the perfusate (D). Error bars = SEM, * P<0.05 between SCS and SCS + SNMP **P<0.05 between SCS and SCS + SNMP and between duration of SCS and next measurement of longer duration of SCS.

