
Figure 1.
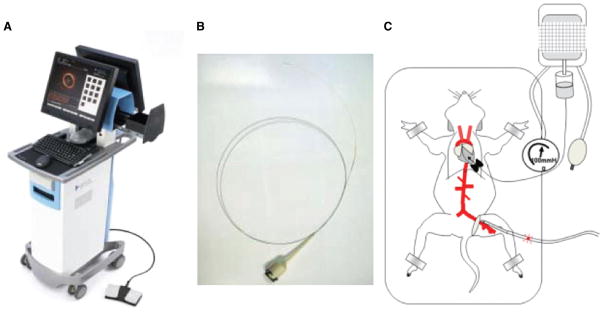
Intra-aortic optical coherence tomography in a mouse apolipoprotein E−/− model. A, Optical coherence tomography (OCT) system console (M2CV OCT Imaging System, LightLab Imaging). B, OCT image wire. C, An illustration of experimental preparation of mouse intraaortic optical coherence tomography.