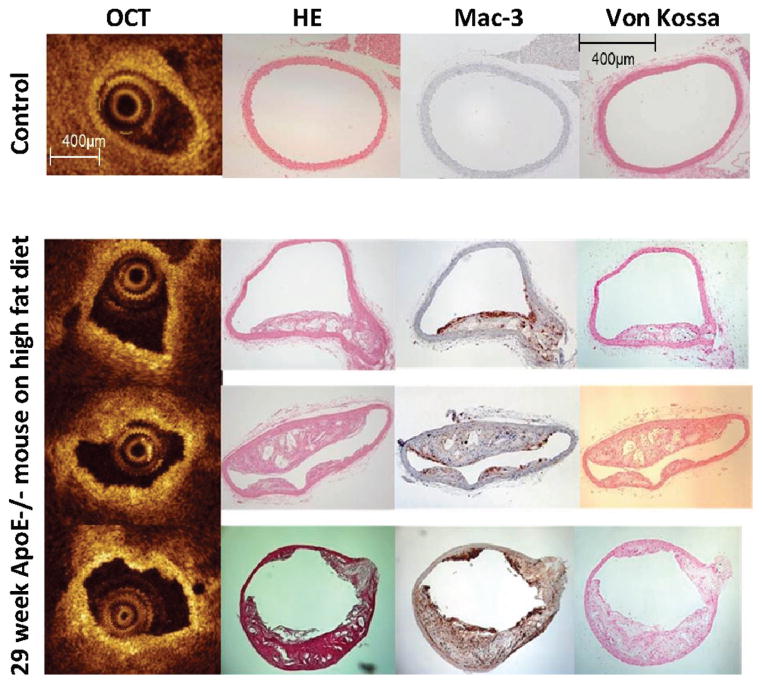
Figure 3.
Macrophage accumulation detected by intra-aortic optical coherence tomography (OCT) and immunohistochemistry in apolipoprotein E (ApoE)−/− mice. Shown are representative intra-aortic OCT cross-sectional images and corresponding hematoxylin and eosin staining (HE), Mac-3 staining, and von Kossa staining from a 9-week ApoE−/− mouse on standard chow diet (control, top row) and a 29-week ApoE−/− mouse on high-fat diet (bottom 3 rows) are shown. Accumulation of macrophages is shown as bright back-scattered reflections on OCT images. Note the smooth, circular contour of the OCT image (top left panel), corresponding to normal wall morphology by histology.

