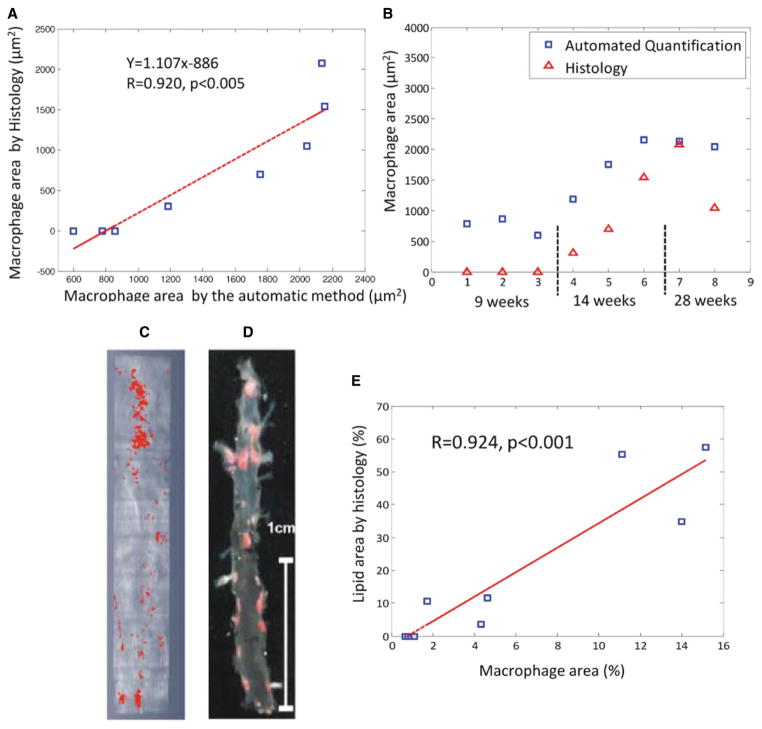
Figure 5.
Correlation between automated macrophage area quantification by optical coherence tomography and immunohistochemistry (Mac-3-positive area) in apolipoprotein E (ApoE)−/− mice for all ApoE−/− mice (A) and mice stratified by age/diet group (B). Macrophage area is represented as the mean area/cross-section. Shown are representative images of en face macrophage area (red) determined by the automatic optical coherence tomography (OCT) algorithm (C) vs Sudan IV staining for lipid accumulation (red) (D) of matched opened and pinned mouse aortas. Correlation between the automatic OCT quantified macrophage area and Sudan IV–positive lipid area in 9 ApoE−/− mice is shown in E.

