
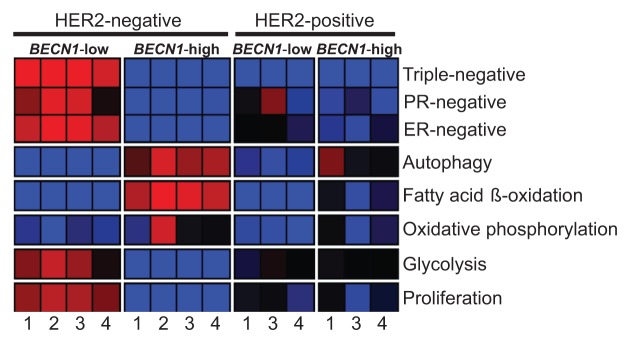
Figure 9. ERBB2-positive breast cancers have, independent of BECN1 expression, gene expression signatures similar to those of non-ERBB2-expressing breast cancers with low BECN1 mRNA levels. The heatmap reports gene set enrichment analysis (GSEA) for selected gene signatures (rows) in breast cancer cohorts defined by ERBB2 and BECN1 status. The color indicates the enrichment (Fischer exact test) of samples with gene signature upregulation (red, P+, enrichment < 0.05), downregulation (blue, P−, enrichment < 0.05), or no difference (black, P+, enrichment ≥ 0.05 and P−, enrichment ≥ 0.05) within a cohort subgroup relative to the remaining samples in the cohort. Gene signature lists and statistical analysis are provided in Figures S3 and S4, respectively. Databases: 1) Decremoux et al. 2011, 2) Hatzis et al. 2011 (ERBB2-negative breast cancers only), 3) Servant et al. 2012, and 4) Sabatier et al. 2011.