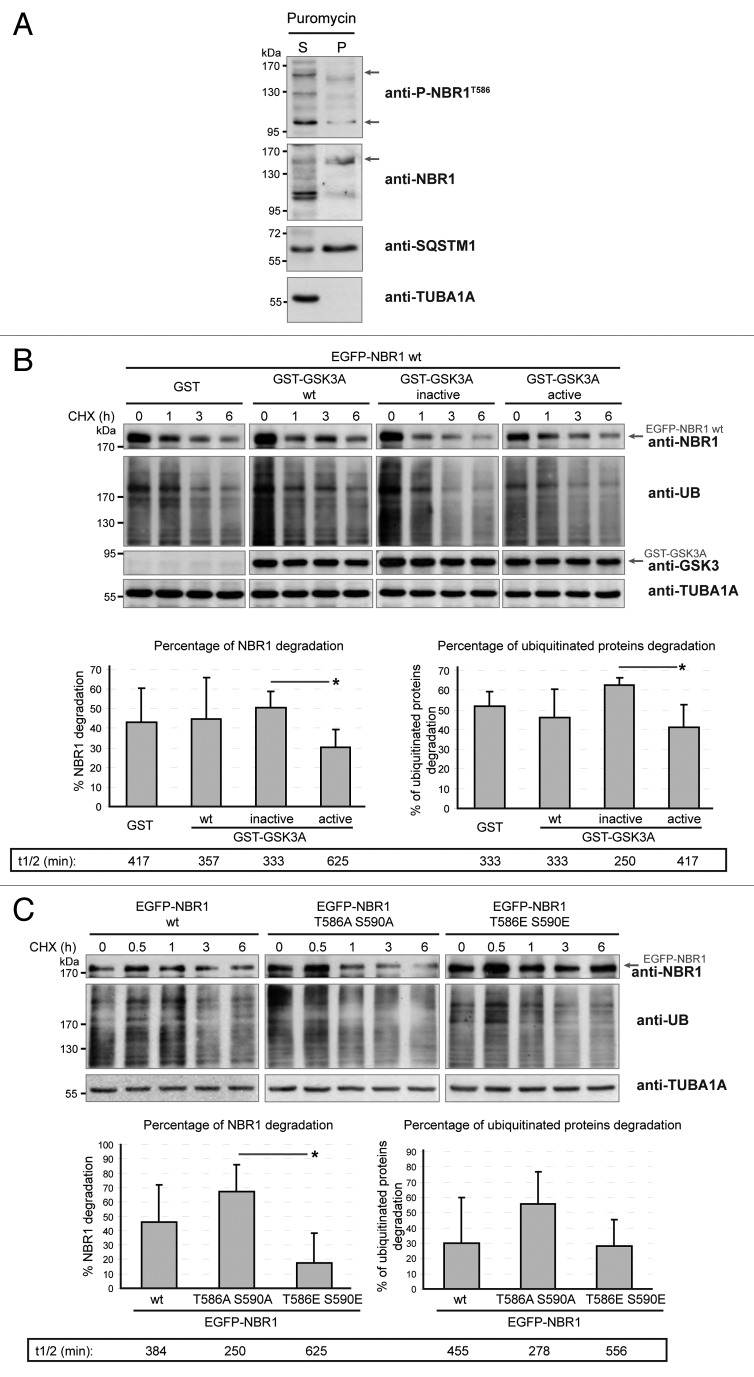
Figure 4. GSK3-mediated phosphorylation inhibits NBR1 adaptor function and this prevents the selective autophagy of ubiquitinated proteins. (A) Western blot of detergent-soluble (Supernatant) and detergent-insoluble (Pellet) fractions of HeLa cells treated with puromycin. Endogenous phospho-NBR1T586, total NBR1, SQSTM1, and TUBA1A/α-TUB (tubulin, α) (loading control) were analyzed by western blot. Arrows show bands that have been found to be specific in NBR1-specific siRNA experiments. The proportion of total NBR1 and phospho-NBR1T586 present in the insoluble fraction was calculated as the ratio of (signal of x in pellet fraction * 100)/(signal of x in supernatant fraction + signal of x in pellet). 24% of phospho-NBR1T586 is present in the detergent-insoluble fraction whereas 74% of total NBR1 is contained in this fraction. (B) Western blot of extracts from C2C12 myoblasts transfected with GST or GST-GSK3A forms (wt, wild-type; inactive, K148A; active, S21A). Cells were treated with CHX and proteins were extracted at different time points to determine NBR1 stability. Ectopic NBR1 was detected with anti-NBR1 antibody and the same patterns were observed with anti-GFP antibody (not shown). Lower panel: quantification of the percentage of NBR1 (left) and of ubiquitinated proteins (right) degradation after 6 h of CHX treatment compared with their initial amounts. Half-life time extrapolations calculated from the quantifications of western blot are shown in rectangles. Data are mean of 3 independent experiments. Error bars represent standard deviations. *P < 0.05, Student t test. (C) Western blot of extracts from C2C12 myoblasts transfected with wild-type or mutant EGFP-NBR1 and treated with CHX. Lower panel: Quantification of the percentage of EGFP-NBR1 (left) and of ubiquitinated proteins (right) degradation after 6 h of CHX treatment compared with their initial amounts. Half-life time extrapolations calculated from quantifications of western blot are shown in rectangles. Data are mean of 3 independent experiments. Error bars represent standard deviations. *P < 0.05, Student t test.

An official website of the United States government
Here's how you know
Official websites use .gov
A
.gov website belongs to an official
government organization in the United States.
Secure .gov websites use HTTPS
A lock (
) or https:// means you've safely
connected to the .gov website. Share sensitive
information only on official, secure websites.
