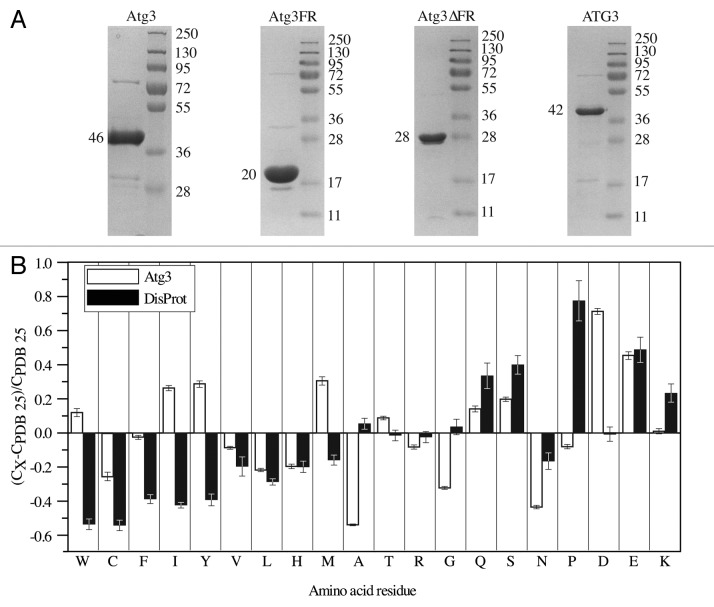
Figure 4. Properties of the Atg3/ATG3 proteins resulting from their amino acid sequence. (A) Migration of the Atg3/ATG3 proteins on a Coomassie Blue-stained gel following SDS-PAGE. The left lane in each panel shows the band corresponding to the purified protein, and the right lane shows protein standard molecular mass markers. The size in kDa is indicated on both sides of each panel. (B) Compositional profiling of Atg3 shows the fractional difference in amino acid composition of Atg3 and a set of intrinsically disordered proteins in the DisProt database relative to a reference set of ordered, globular proteins in the PDB.

An official website of the United States government
Here's how you know
Official websites use .gov
A
.gov website belongs to an official
government organization in the United States.
Secure .gov websites use HTTPS
A lock (
) or https:// means you've safely
connected to the .gov website. Share sensitive
information only on official, secure websites.
