
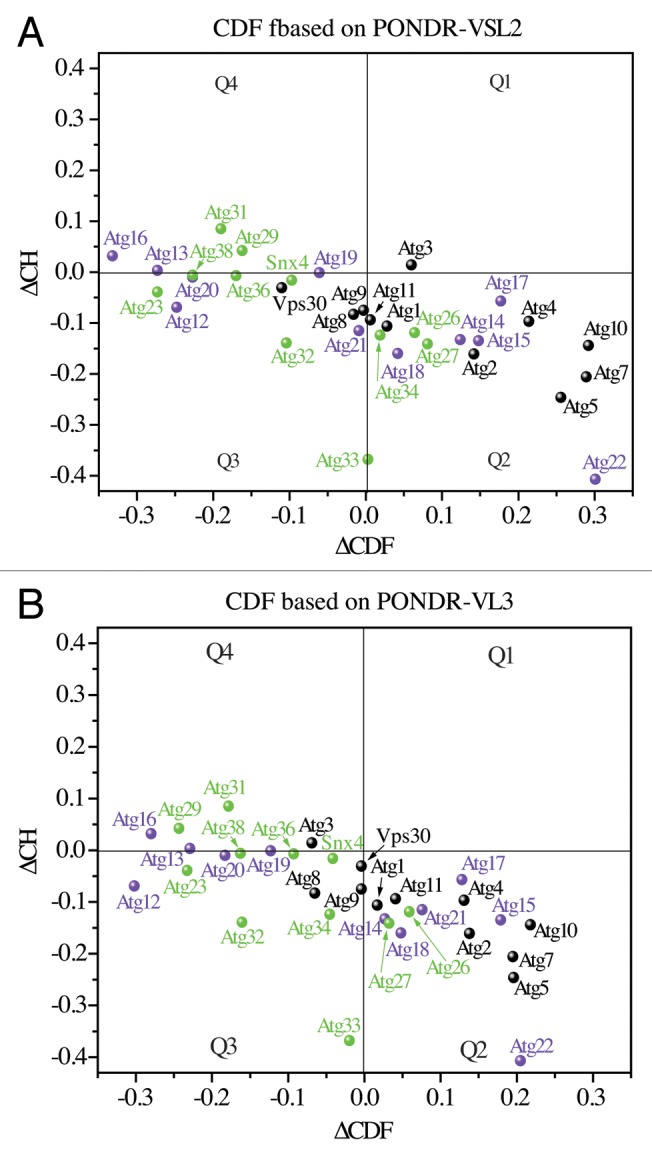
Figure 6. ∆CH-∆CDF analysis of Atg proteins from yeast. The ∆CH-∆CDF plots, where the ∆CDF parameter was calculated based on PONDR-VSL2 (A) and PONDR-VL3 (B), show the distribution of the Atg proteins from yeast in the Q1, Q2, Q3, and Q4 quadrants. For description of quadrants, see the legend for Figure 5. For better clarity, Atg1, Atg2, Atg3, Atg4, Atg5, Vps30/Atg6, Atg7, Atg8, Atg9, Atg10, and Atg11 are shown in black, Atg12, Atg13, Atg14, Atg15, Atg16, Atg17, Atg18, Atg19, Atg20, Atg21, and Atg22 are labeled in purple, and Atg23, Snx4/Atg24, Atg26, Atg27, Atg29, Atg31, Atg32, Atg33, Atg34, Atg36, and Atg38 are marked in green.