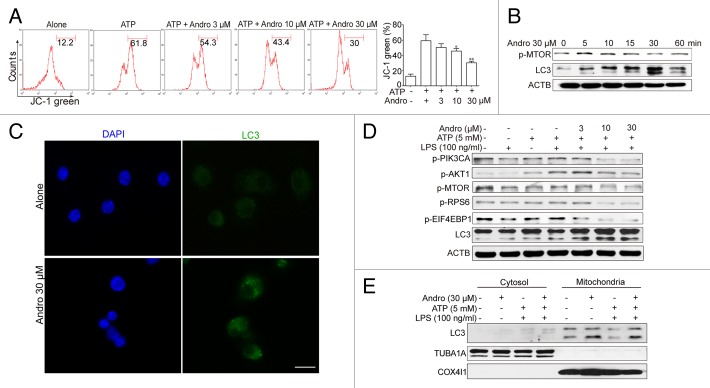
Figure 6. Andrographolide promotes mitophagy and inhibits NLRP3 inflammasome activation in macrophages. (A) THP-1 cells, pretreated with 500 nM PMA for 3 h, were cultured with 100 ng/ml LPS for 3 h (below referred to as LPS-primed THP-1 cells), then cells were treated with Andro (3, 10, or 30 μM) for 1 h, followed by 1 h incubation with 5 mM ATP. The mitochondrial membrane potential was determined by JC-1 staining. *P < 0.05, **P < 0.01 vs. ATP group. (B) LPS-primed THP-1 cells were treated with 30 μM Andro for the indicated times. Proteins were collected and the expression of p-MTOR and LC3 was detected by western blot. (C) BMDM cells were cultured with 100 ng/ml LPS for 3 h, and then cells were treated with 30 μM Andro for 1 h. LC3-II dot formation was detected by immunofluorescence. Scale bar: 10 μm. (D) LPS-primed THP-1 cells were treated with Andro (3, 10, or 30 μM) for 1 h, followed by 1 h incubation with 5 mM ATP. Then proteins were collected and analyzed by western blotting. (E) LPS-primed THP-1 cells were treated with 30 μM Andro for 1 h, followed by 1 h incubation with 5 mM ATP. Then mitochondria and cytosol were separated using a commercial kit and detected for LC3 expression. Data shown in (A) are mean ± SEM of 3 different experiments. Data shown in (B–E) are representative of 3 experiments. Andro, andrographolide.

An official website of the United States government
Here's how you know
Official websites use .gov
A
.gov website belongs to an official
government organization in the United States.
Secure .gov websites use HTTPS
A lock (
) or https:// means you've safely
connected to the .gov website. Share sensitive
information only on official, secure websites.
