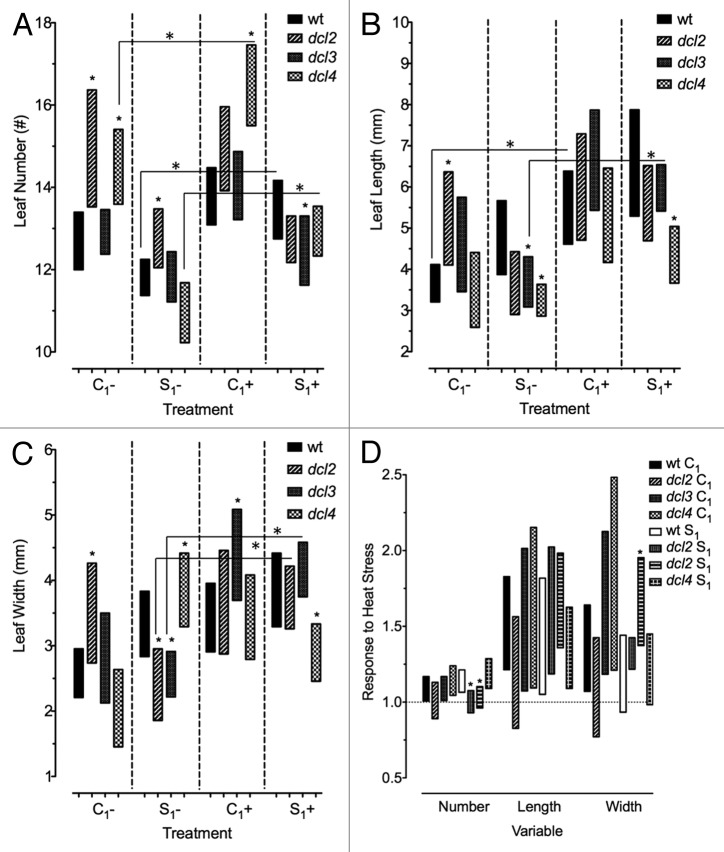
Figure 1. Impact of heat stress on the number and the size of leaves in the progeny of heat stressed and control plants. Plants were stressed at 50 °C for 3 h, on 5 consecutive days. Measurements were taken for leaf number, length, and width. All confidence intervals are a result of bootstrap x 10,000, at 95% confidence (P = 0.05) (A-C) Leaf number (A), length (B), and width (C) in F1 progeny of wild type (15D8) and mutant (dcl2, dcl3, and dcl4) plants, as indicated by Legend, exposed to heat and control plants. “C1” – the progeny of plants grown at normal conditions in F0. “S1” – the progeny of plants exposed to heat in F0. “+” and “-” indicate exposure to stress or growth in uninduced conditions, respectively, each of which had approximately 24 plants. Asterisks (*) indicate a significant difference from wild type, with the same treatment group, or difference between treated and non-treated plants within the same F0 treatment (C1+ vs C1- and S1+ vs S1-) within the same mutant, as calculated using a t test (P ≤ 0.05). (D) Bars represent ratio of change in F1 plants in response to heat stress (S+/S- or C+/C-), and those that overlap with value of 1 indicate no significant change under heat stress. Asterisks (*) are used to indicate mutants that are significantly different from wild-type (15D8) plants with the same treatment. Legend indicates parental treatment.

An official website of the United States government
Here's how you know
Official websites use .gov
A
.gov website belongs to an official
government organization in the United States.
Secure .gov websites use HTTPS
A lock (
) or https:// means you've safely
connected to the .gov website. Share sensitive
information only on official, secure websites.
