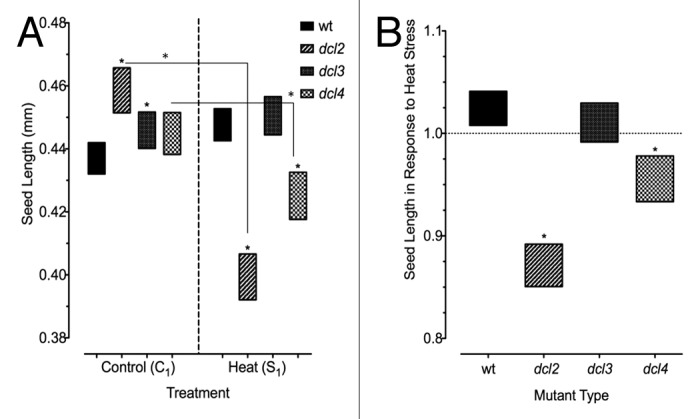
Figure 2. Size of seeds produced by heat stressed and control plants. Approximately 100–200 seeds per sample group. (A) Seed size in F1 progeny of wild type (15D8) and mutant (dcl2, dcl3, and dcl4) plants, as indicated by Legend, exposed to heat and control plants. “C1” – the progeny of plants grown at normal conditions in F0. “S1” – the progeny of plants exposed to heat in F0. Asterisks (*) indicate a significant difference from wild type, with the same treatment group, or difference between different treatments (C1 vs S1) within the same mutant, as calculated using a t test (P ≤ 0.05). (B) Bars represent ratio of change in seeds produced by plants that had been heat stressed (S1/C1), and those that overlap with value of 1 indicate no significant difference in seed size in response to heat stress. Asterisks (*) are used to indicate mutants that are significantly different from wild-type (15D8) plants with the same treatment, as calculated using a t test (P ≤ 0.05). Legend indicates parental treatment.
