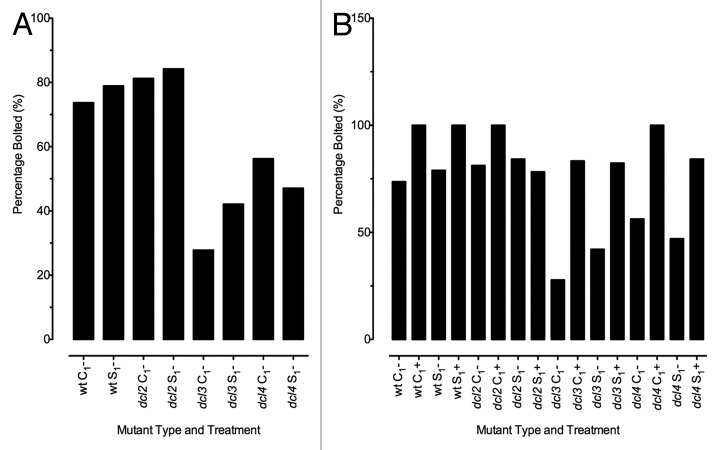
Figure 3. Percentage of F1 plants that had bolted at approximately 4 wk of age. Approximately 24 plants were included in each treatment group. (A) Comparison of bolting in F1 plants when grown at normal conditions. (B) Comparison of bolting in F1 plants when grown under either normal (-) or stressed (+) conditions. Each treatment group is labeled according to treatment and mutant type, on the horizontal axis.

An official website of the United States government
Here's how you know
Official websites use .gov
A
.gov website belongs to an official
government organization in the United States.
Secure .gov websites use HTTPS
A lock (
) or https:// means you've safely
connected to the .gov website. Share sensitive
information only on official, secure websites.
