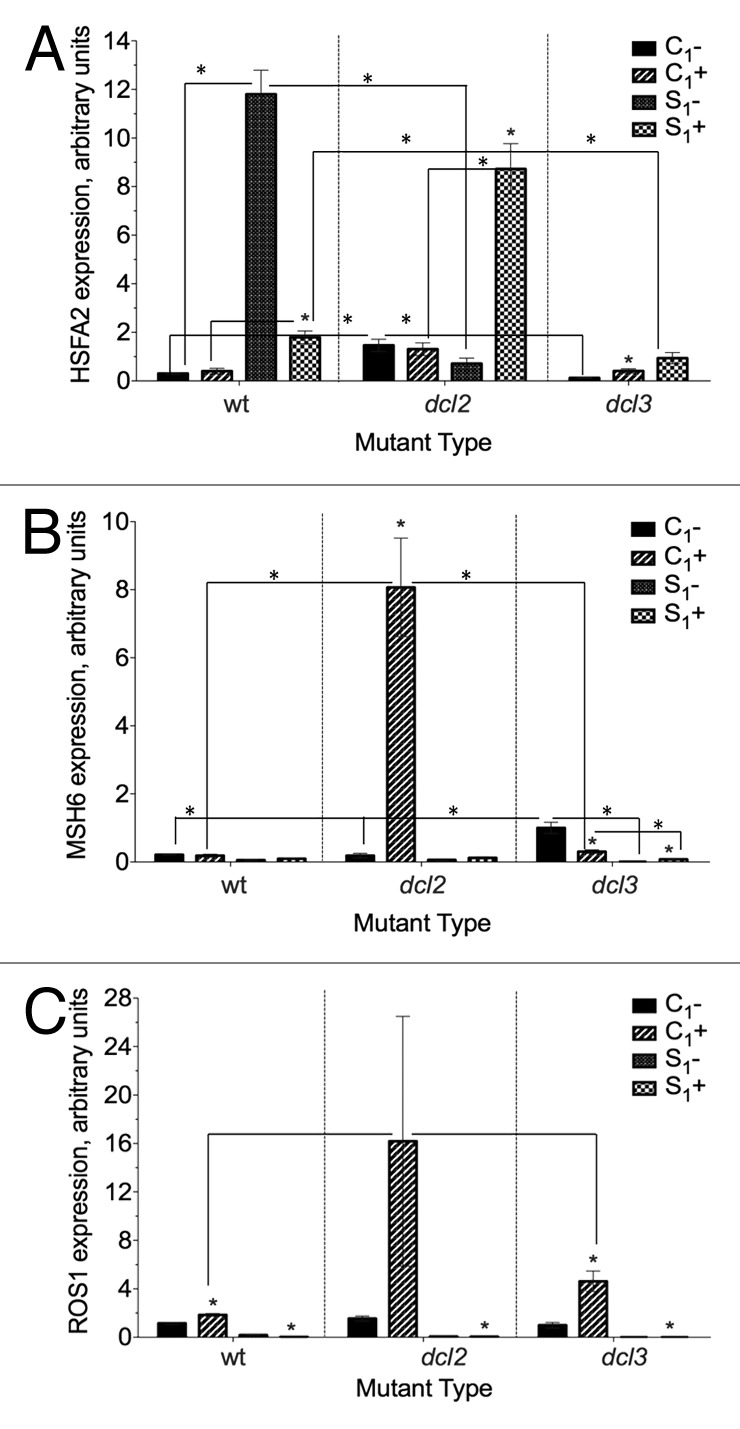
Figure 6. Expression of (A) HSFA2 (B) MSH6 (C) ROS1 in F1 progeny of wild type (15D8) and mutant (dcl2 and dcl3) plants exposed to heat and control plants. Y-axis shows arbitrary units of gene expression, standardized to tubulin. “C1” – the progeny of plants grown at normal conditions in F0. “S1” – the progeny of plants exposed to heat in F0. “+” and “-” indicate exposure to stress or growth in uninduced conditions, respectively. Bars show standard error of the mean (SEM) calculated from 3 technical repeats. Asterisks (*) indicate a significant difference between control (-) and stress (+) with the same parental treatment, between different treatments (C1 vs S1) or between different mutants, as calculated using a t test (P ≤ 0.05).
