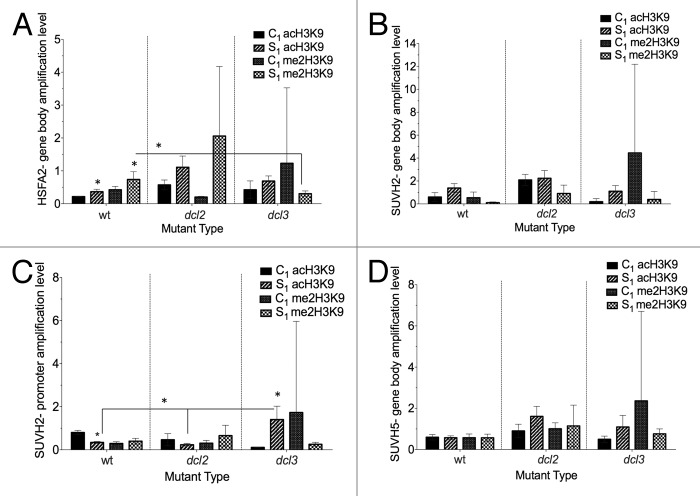
Figure 8. Analysis of H3K9me2 and H3K9ac histone modifications in HSFA2, SUVH2, SUVH5 genes. PCR analysis was done in the progeny of heat-stressed (S1) and control (C1) plants using primers specific to the gene body region of HSFA2 (A), promoter region of SUVH2 (B), gene body region of SUVH2 (C), and gene body region of SUVH5 (D). The y-axis shows the levels of H3K9me2/H3K9ac expression in average arbitrary units (calculated from 2 technical repeats). The x-axis indicates the mutant type. The asterisks (*) denotes a significant differences between the progeny of control and the progeny of stressed or between mutants for the same treatment, as determined with a t test (P ≤ 0.05).

An official website of the United States government
Here's how you know
Official websites use .gov
A
.gov website belongs to an official
government organization in the United States.
Secure .gov websites use HTTPS
A lock (
) or https:// means you've safely
connected to the .gov website. Share sensitive
information only on official, secure websites.
