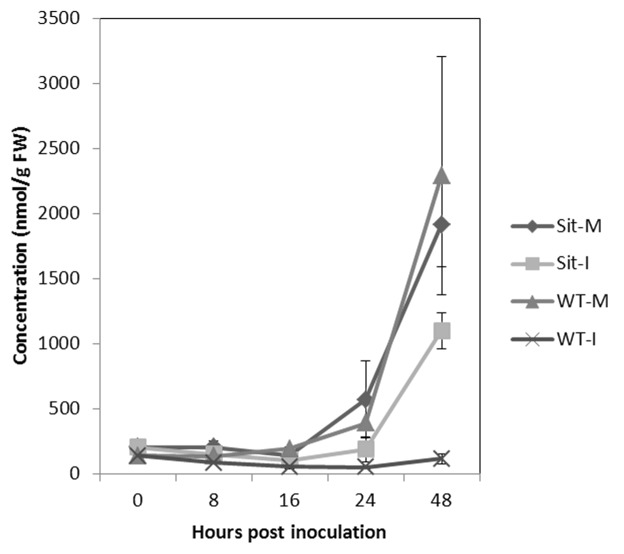
Figure 3. Alterations in asparagine levels in mock-treated (M) and Botrytis-inoculated (I) sitiens (Sit) and wild-type (WT) tomato plants at different time points post inoculation. Metabolic analysis of free amino acid levels was conducted as described before.12 Error bars represent ± SE of 3 biological replicates.

An official website of the United States government
Here's how you know
Official websites use .gov
A
.gov website belongs to an official
government organization in the United States.
Secure .gov websites use HTTPS
A lock (
) or https:// means you've safely
connected to the .gov website. Share sensitive
information only on official, secure websites.
