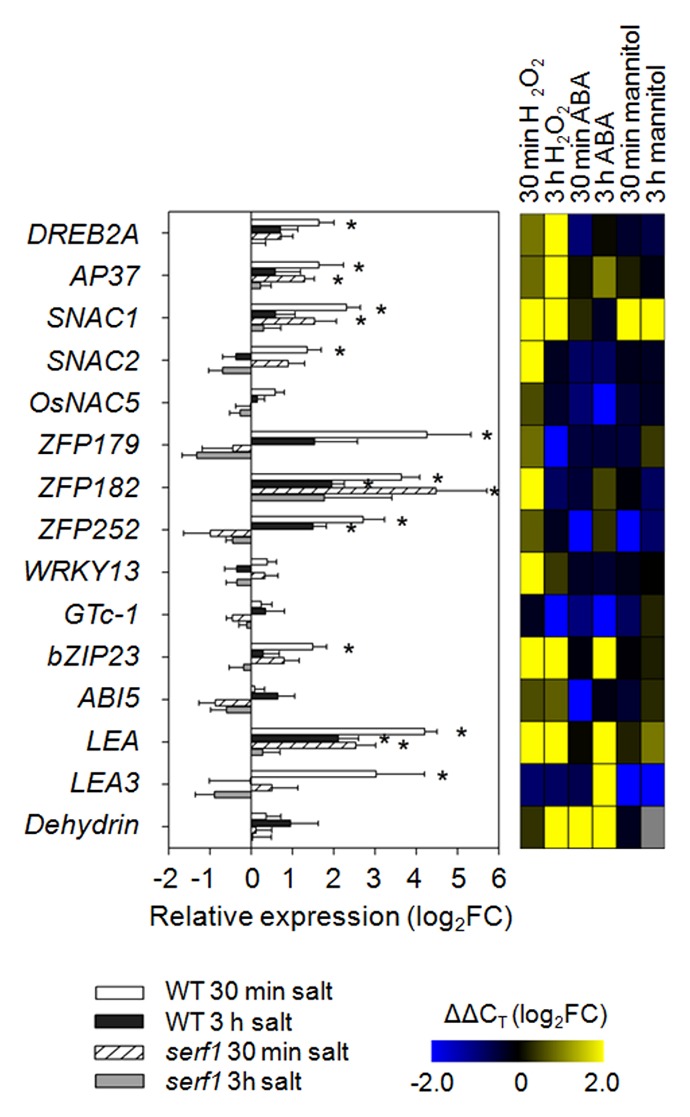
Figure 3. Effect of SERF1 on the expressional response of transcription factor genes in leaves. Expression levels of transcription factor genes and salt stress markers were measured in leaves of wild-type and serf1 plants subjected to salt stress for 30 min or 3 h (100 mM NaCl). ACTIN (Os03g50885) was used as reference gene. Data represent means ± SE from 3 biological replicates. An asterisk (*) indicates a significant difference between treated and control plants (P ≤ 0.05; the Student t test). In the heat map the gene expression under H2O2 (5 mM), ABA (5 µM) or mannitol (100 mM) treatment is shown in log2FC relative to the control situation with n = 3. WT; wild type; FC, fold change.
