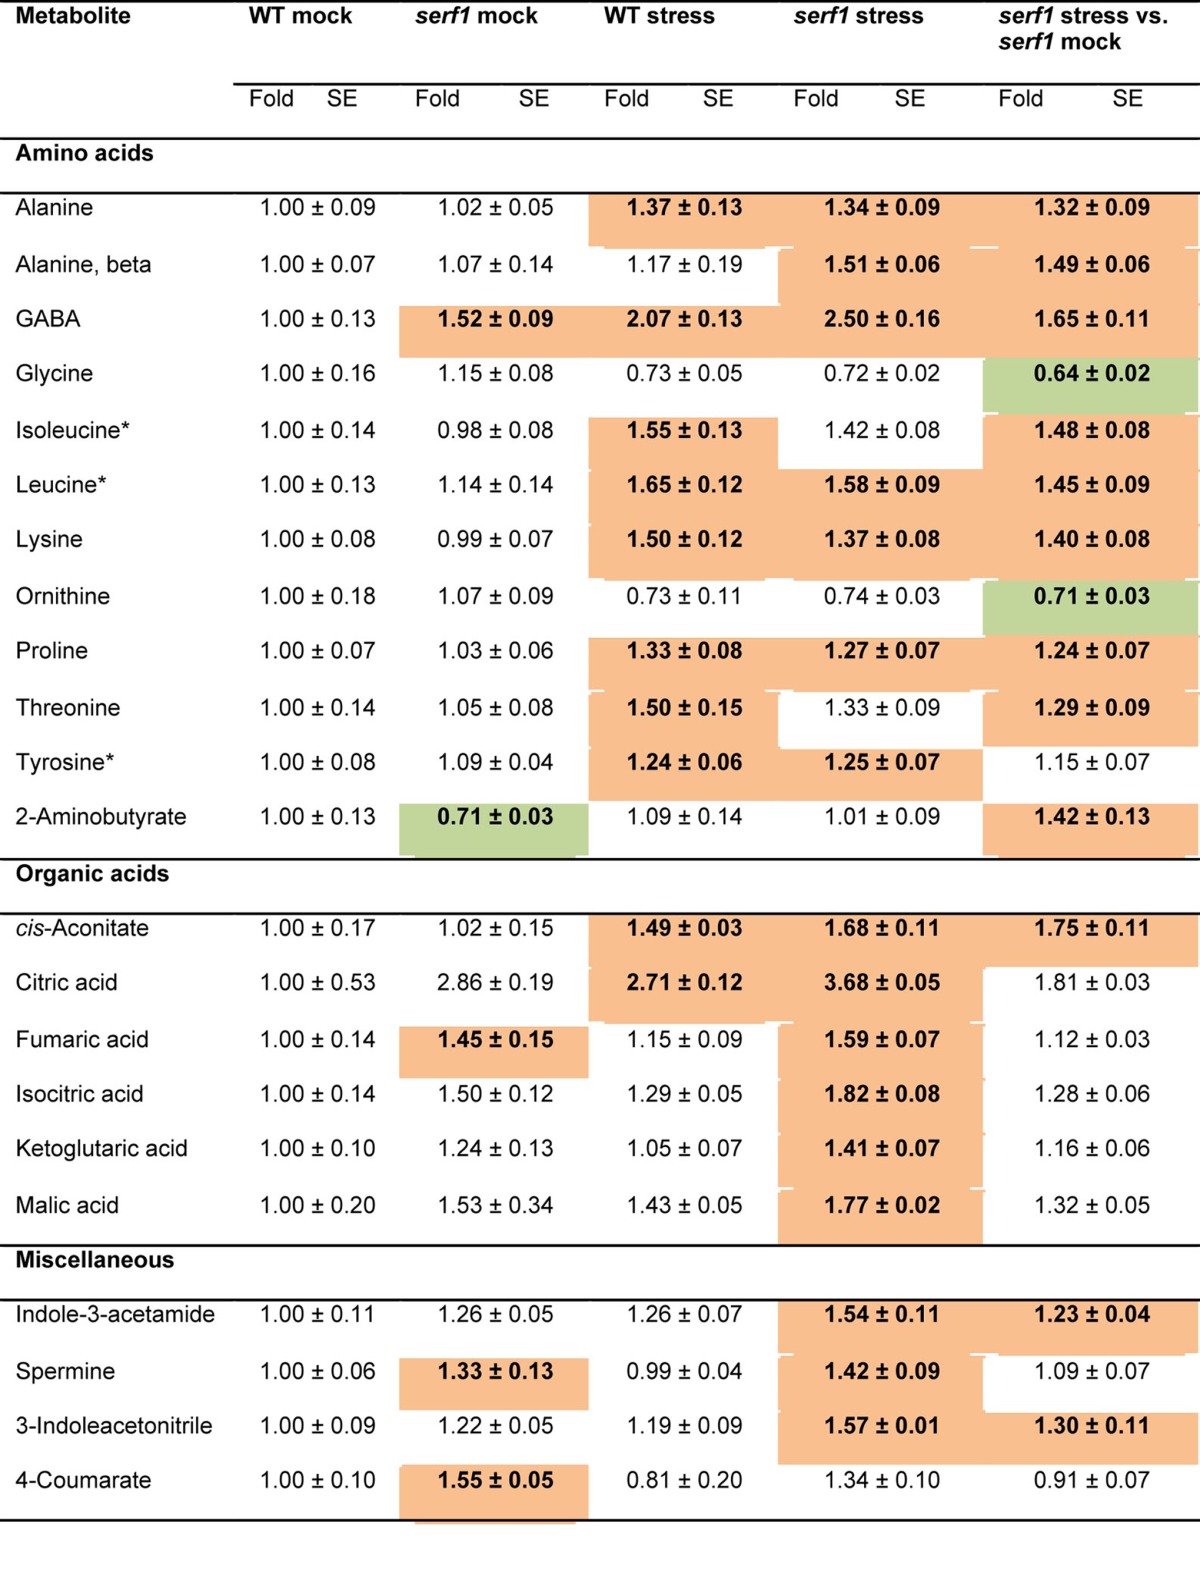
Table 1. Relative metabolite content in roots of 4-wk-old wild type and serf1 under control conditions and after 3 h of salt stress.

Data for serf1 (mock and stress) and the wild type under salt stress (100 mM NaCl) are normalized to the mean levels of wild type under control conditions. In addition, the metabolite content of serf1 upon stress is shown, normalized to the mean levels of serf1 mock. Values are presented as means ± SE of 6 biological determinations. Bold indicates values that were determined by Student's t test to be significantly different (P≤ 0.05) from the control. Orange and green shading indicate significant up- and downregulation, respectively, as compared with controls. Asterisks indicate ABA-dependent metabolites.21
