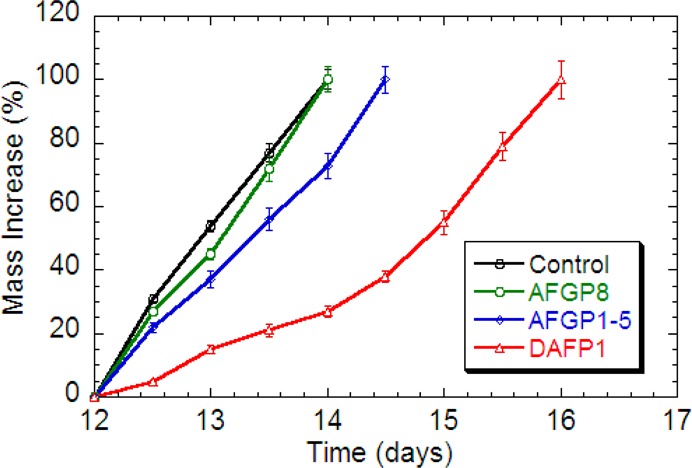
Figure 4.

Crystallization kinetics of MDM in the presence of AFGP8 (green), AFGP1–5 (blue), and DAFP1 (red), respectively. The data of the control (black) are the average data of MDM in the absence and presence of the three controls, Gal1-β-3GalNAc, LCA, and denatured DAFP1. The error bars represent the standard deviation from at least three measurements.
