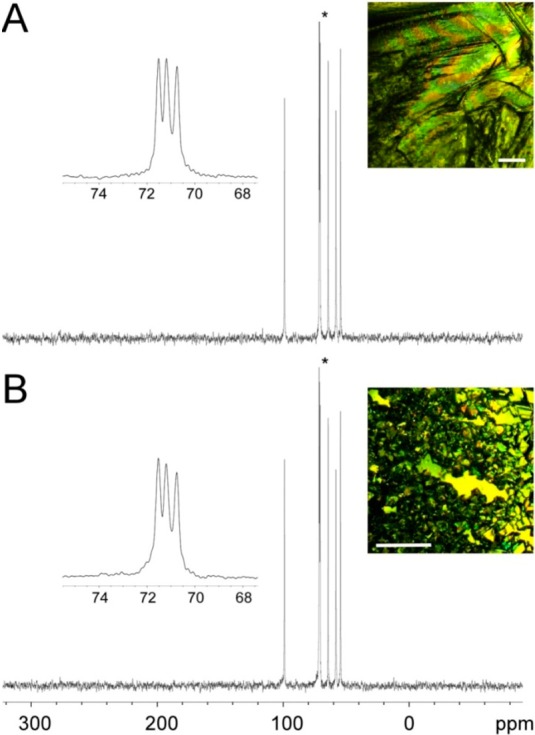
Figure 6.

Representative CPMAS 13C NMR spectra of the MDM crystals in the absence and presence of AF(G)Ps. The CPMAS 13C NMR spectra of MDM crystals in the absence of AF(G)Ps (A) and in the presence of DAFP1 (B). The insets show the details of the peak with an asterisk and the habits of the MDM crystals are shown at the right upper corner of each panel (the length of the scale bars is 1 mm).
