
Figure 6.
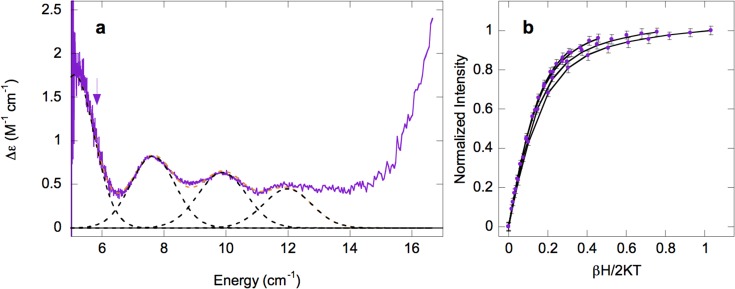
VTVH MCD analysis of α-KG-Fe(II)/Cl–-Ac-HctB. (a) MCD spectrum with arrows marking the energy at which VTVH MCD data were collected at (b) 5750 cm–1 (purple). Data were collected at 2.3, 3.3, 5, and 7.5 K. Error bars for the data are shown.