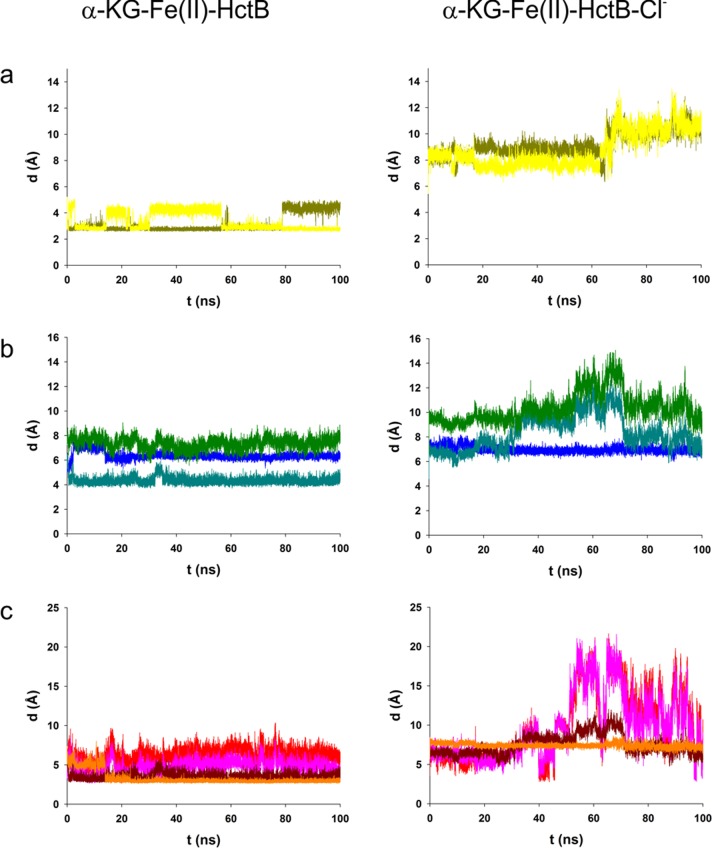
Figure 8.
Trajectories from 100 ns MD simulations depicting distances of residues involved in the chloride-triggered structural rearrangement in HctB in the absence (left panels) and presence (right panels) of 1 M chloride. Panel a shows distances of O-5 and O-5′ of Glu224 to Fe(II). Panel b displays backbone distances from C-2 of Asn140 to N-2 of Glu224 (blue); N-2 of Val114 to C-2 of Glu224 (teal); and C-2 of Tyr115 to C-2 of Arg225 (green). Panel c gives the distances of the putative H-bonding atoms O-7 of Tyr115 to N-ω of Arg225 (red); O-7 of Tyr115 to N-ω′ of Arg225 (pink); N-2 of Val114 to O-1 of Glu224 (dark red); and O-4 of Asn140 to N-2 of Glu224 (orange).

