
Figure 6.
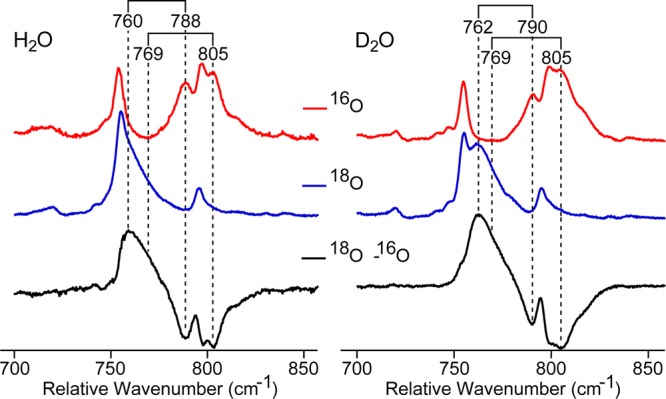
Low-frequency resonance Raman of 16O/18O Mb-II at pH 4.4 (left) and pD 4.8 (right) in acetate buffer. The resonances near ∼720 cm–1 were used to scale the spectra. Data were collected using the 501.7 nm argon-ion laser line.
Official websites use .gov
A
.gov website belongs to an official
government organization in the United States.
Secure .gov websites use HTTPS
A lock (
) or https:// means you've safely
connected to the .gov website. Share sensitive
information only on official, secure websites.
Low-frequency resonance Raman of 16O/18O Mb-II at pH 4.4 (left) and pD 4.8 (right) in acetate buffer. The resonances near ∼720 cm–1 were used to scale the spectra. Data were collected using the 501.7 nm argon-ion laser line.