Fig. 6.
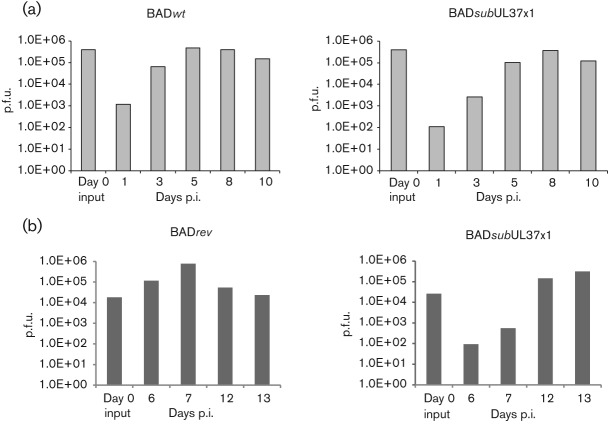
Production of BADwt and BADsubUL37x1 infectious progeny in hNPCs. (a) hNPCs were infected with BADwt (left) or with BADsubUL37x1 (right) at an m.o.i. of 1. Supernatants were harvested at the indicated times and the levels of total infectious progeny per well were determined by plaque formation on indicator HFFs. Shown is a representative result of two independent experiments with duplicate samples for each. (b) hNPCs were infected with BADrev (left) or with BADsubUL37x1 (right) at an m.o.i. of 0.3 and infectious progeny was determined as in (a). Values from triplicate wells were averaged for each time point.

