
Fig. 2.
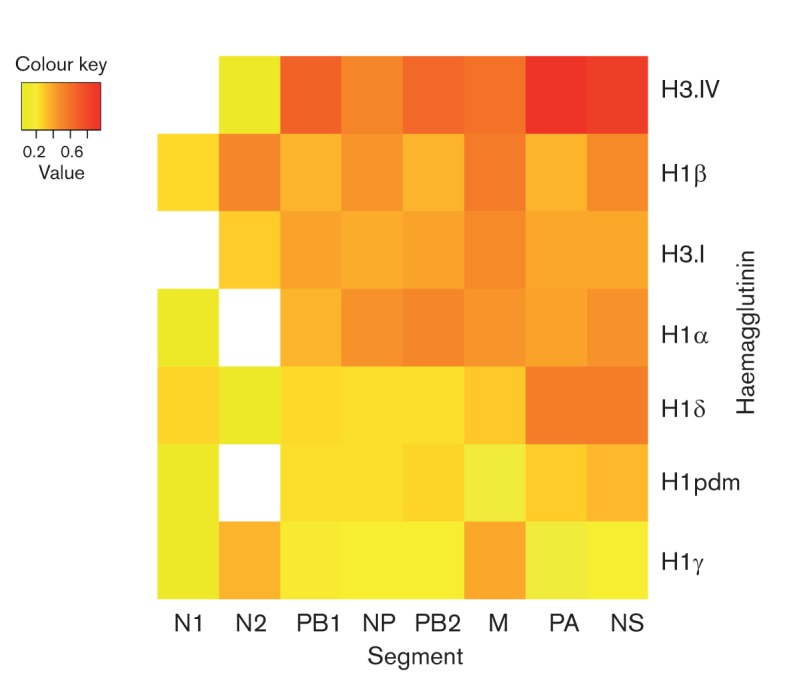
Relative frequencies of reassortment for each genome segment among seven antigenic lineages of influenza virus in North American swine, coded by colour: lower expected/observed ratios (<0.2) are yellow, middle rates (0.2–0.6) are orange and higher rates (>0.6) are red. Frequency estimates represent the ratio of association between the HA type and phylogeny as expected under the null hypothesis of a random association between the phylogeny and HA type versus the association that is observed in the data; hence, a higher number indicates higher levels of reassortment. The x-axis and y-axis are sorted in order of reassortment frequency, such that the lowest frequencies appear in the bottom left and the highest in the upper right. Blank squares indicate a viral sample number (n≤1) for which rates could not be estimated.