
Figure 3.
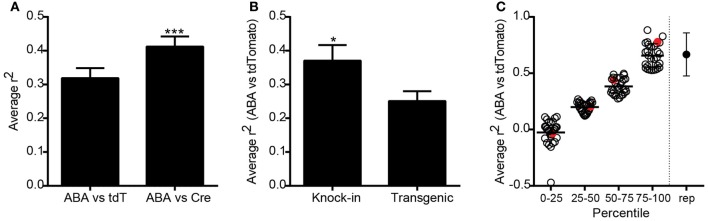
Overall correlations between Cre expression and corresponding endogenous gene expression across all Cre lines. (A) Expression energy values across 295 annotated structures covering the entire brain were correlated between tdTomato or Cre ISH datasets, and each endogenous gene profile corresponding to the unique promoter driving Cre expression from the Allen Brain Atlas (ABA). The average correlation between ABA and tdTomato datasets was positive (n = 119 lines, r2 = 0.32, Spearman correlation). The average correlation between ABA and Cre ISH datasets was significantly higher (n = 83 paired lines, r2 = 0.41, paired t-test ***p < 0.001). (B) Cre reporter (tdTomato) expression values across the whole brain were significantly more similar to the corresponding ABA gene expression values in knock-in compared with transgenic Cre lines (unpaired t-test, n = 52 knock-in and 66 transgenic, *p < 0.05). (C) Scatter plot showing the ABA vs. tdTomato whole brain r2-value for each of the 119 Cre lines grouped by percentile rank. The point on the far right shows the average r2-value between biological replicates within a Cre line for comparison. Red circles indicate examples shown in Figure 4.