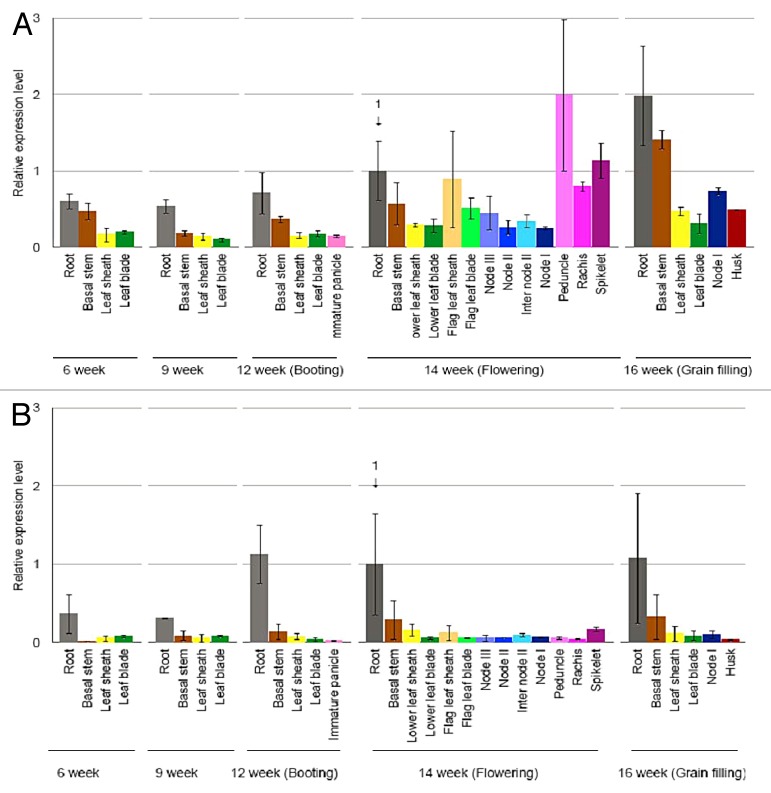
Figure 1. Expression pattern of OsASL1.1 and OsASL1.2. Different organs at various stages of rice grown in paddy field were sampled for RNA extraction. The expression was determined by real-time quantitative RT-PCR. Expression of OsASL1.1 (A) and OsASL1.2 (B) relative to the root at flowering stage is shown. HistoneH3 was used as an internal standard. Data are means ± SD of 3 biological replicates.

An official website of the United States government
Here's how you know
Official websites use .gov
A
.gov website belongs to an official
government organization in the United States.
Secure .gov websites use HTTPS
A lock (
) or https:// means you've safely
connected to the .gov website. Share sensitive
information only on official, secure websites.
