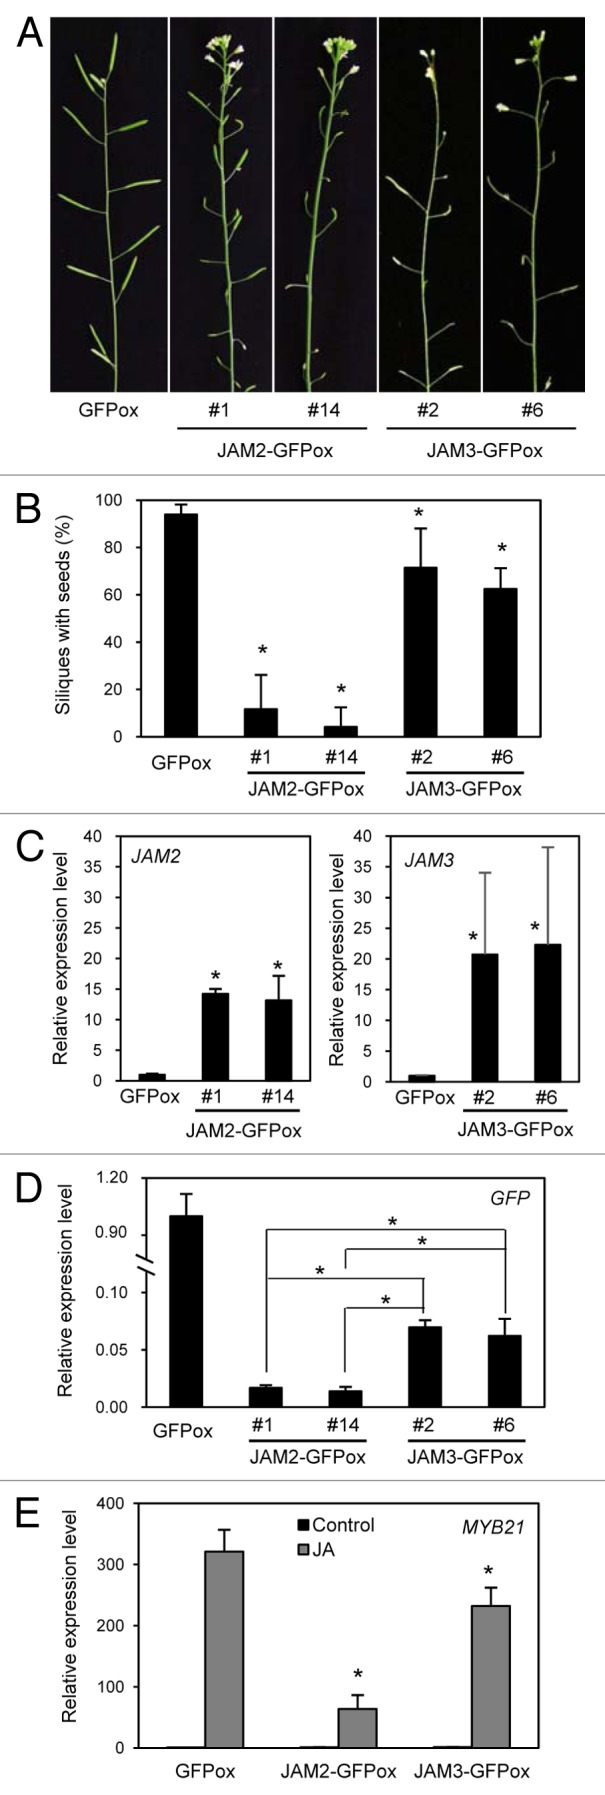
Figure 2. Reduced fertility of JAM2- and JAM3-overexpressing plants. (A) Inflorescences of 6-week-old transgenic plants expressing GFP, JAM2-GFP #1 and #14, and JAM3-GFP #2 and #6 (left to right). (B) Ratio of siliques with seeds to total silique number. Error bars indicate SD of 4 independent lines. Asterisks indicate significant difference from GFP-expressing plants (Student t-test, p < 0. 05). (C) Relative expression levels of JAM2 and JAM3 in inflorescences. The value for plants transgenically expressing GFP alone (and thus expressing JAM2 and JAM3 only from the endogenous loci) was set to 1, and the relative values are shown. Error bars represent SD of results from 3 biological replicates. Asterisks indicate significant difference from GFP-expressing plants (Student t-test, p < 0. 05). (D) Relative expression levels of GFP in inflorescence. Relative values and SD were calculated as in C. Asterisks indicate significant difference (Student t-test, p < 0. 05). (E) Relative expression levels of MYB21 with (gray bar) and without (black bar) MeJA treatment. Seedlings grown for 8 d on MS medium were treated with 50 μM MeJA for 1 h. The value for plants expressing GFP without JA treatment was set to 1, and the relative values are shown. Error bars represent SD of results from 3 biological replicates. Asterisks indicate significant difference from GFP-expressing plants (Student t-test, p < 0. 05).
