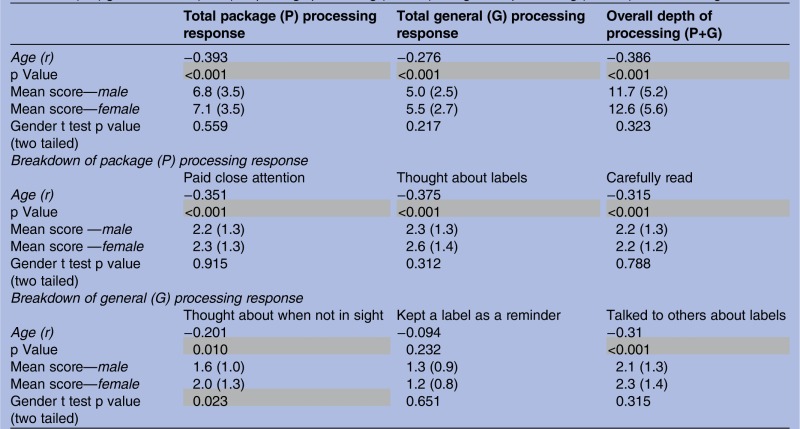
Table 6.
Age and gender differences in the processing of graphic health warning labels, showing Pearson's correlation with age and mean (SD) gender scores (1–10), in package processing (3 items) and general processing (3 items) of the warning labels
 |
The overall processing is shown in the third column. Statistically significant values are highlighted in grey.
