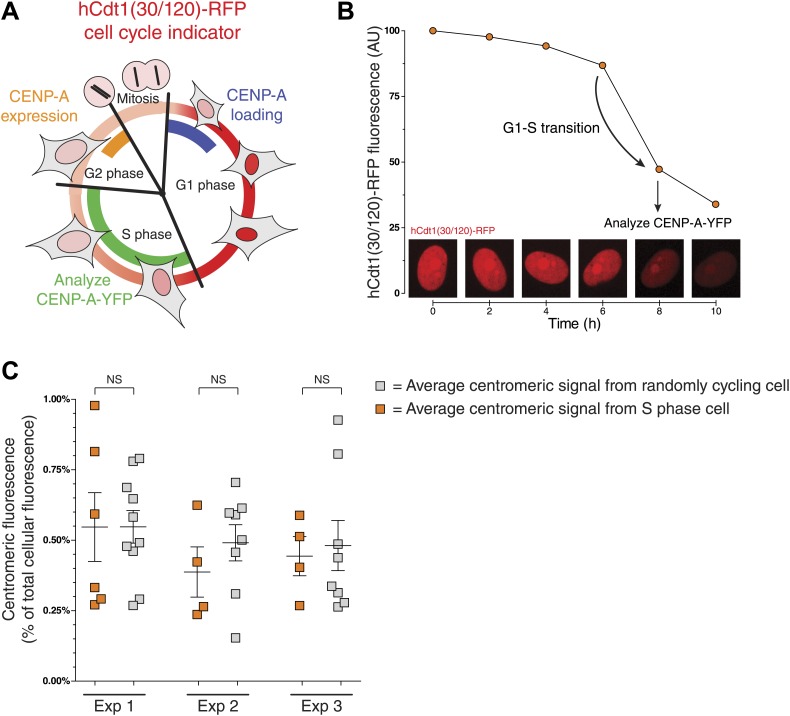
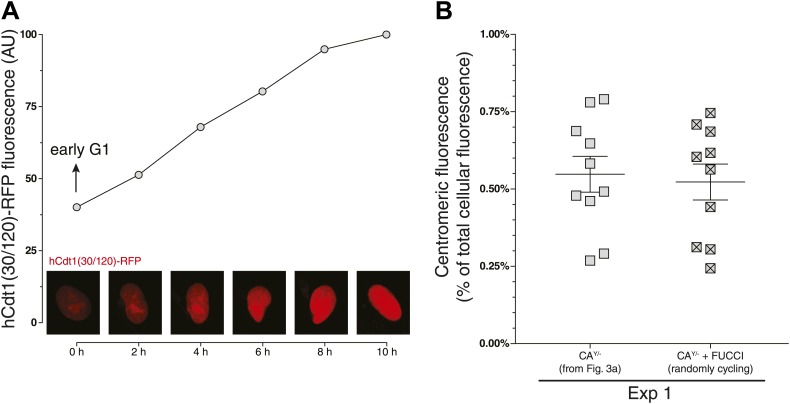
Figure 3. Centromeric CENP-A levels are equivalent between S phase and randomly cycling cells.
(A) Cartoon depicting changes in cell morphology and nuclear levels of hCdt1(30/120)-RFP (in red) throughout the cell cycle (Sakaue-Sawano et al., 2008). Approximate timing of CENP-A expression (Shelby et al., 2000) and centromeric loading (Jansen et al., 2007) are indicated in orange and blue, respectively. The stage at which cells were analyzed to measure the centromeric fraction of CENP-A is indicated in green. (B) An example trace of a cell entering S phase (indicated by a sudden decrease in RFP levels) is shown. The centromeric fraction of CENP-A was measured at this point as outlined in Figure 2A. Peak expression is normalized to 100 and background fluorescence to 0. Micrographs of hCdt-1(30/120)-RFP at indicated timepoints are shown below. (C) As in Figure 2C. Orange squares represent cells that have passed the G1-S transition point, as indicated by decreasing levels of hCdt-1(30/120)-RFP. Gray squares represent randomly cycling cells. No statistically significant differences (NS) were observed between randomly cycling cells and S phase cells.


