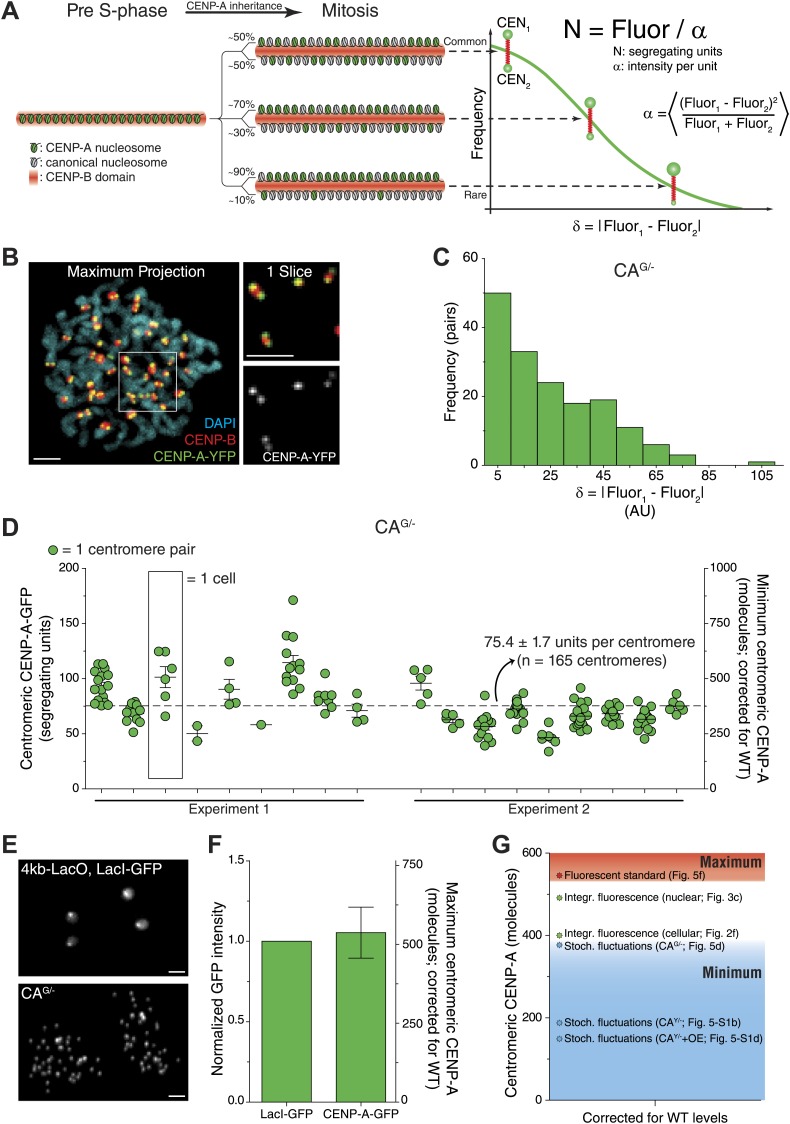
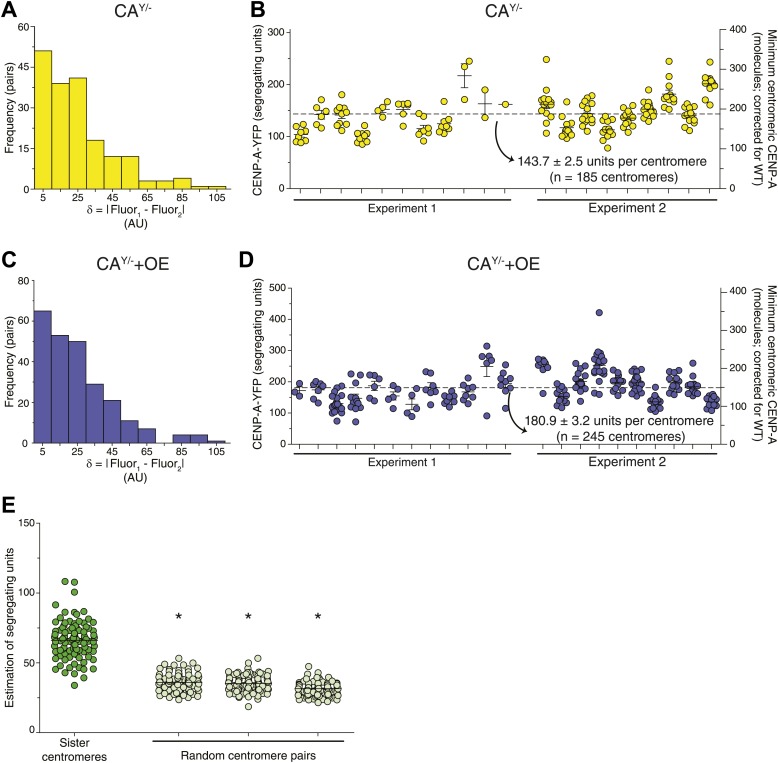
Figure 5. Independent quantification methods confirm centromeric CENP-A copy number.
(A) Stochastic fluctuation method: cartoon depicting inheritance and random redistribution of parental CENP-A nucleosomes onto sister chromatids during DNA replication. A hypothetical distribution of the absolute difference between the two sister centromeres, as well as the formula for calculating the fluorescence intensity per segregating unit (α) are indicated on the right. (B) Representative image of mitotic CENP-A-YFP expressing cell. CENP-B staining allows for identification of sister centromeres. Blowup to the right represents a single slice of the boxed region showing that CENP-B is located in between the CENP-A spots of sister centromeres. (C) Frequency distribution of the difference between CENP-A-GFP intensity of sister centromeres in CAG/− cells. (D) Quantification of centromeric CENP-A-GFP based on the stochastic fluctuation method. Each circle represents one centromere; circles on the same column are individual centromeres from the same cell. Left y-axis indicates segregating CENP-A-GFP units in CAG/− cells; right y-axis shows the conversion to minimum number of centromeric CENP-A molecules in CA+/+ (WT) cells. (E) Fluorescent standard method: representative fluorescence images of 4kb-LacO, LacI-GFP S. cerevisiae and human CAG/− cells. (F) Quantification of fluorescence signals of LacI-GFP and CENP-A-GFP spots (n = 2 biological replicates). The left y-axis indicates the fluorescence intensity normalized to LacI-GFP; the right y-axis shows the conversion to maximum number of centromeric CENP-A molecules in wild-type cells. (G) Comparison of independent measurements for the centromeric CENP-A copy number (corrected for CA+/+ levels; Stoch. fluctuations = stochastic fluctuation method [Figure 5A]; Integr. fluorescence = integrated fluorescence method [Figure 2A]). Levels from all strategies are corrected for CA+/+ (WT) levels. Throughout, the average ± SEM and scale bars of 2.5 μm are indicated.


