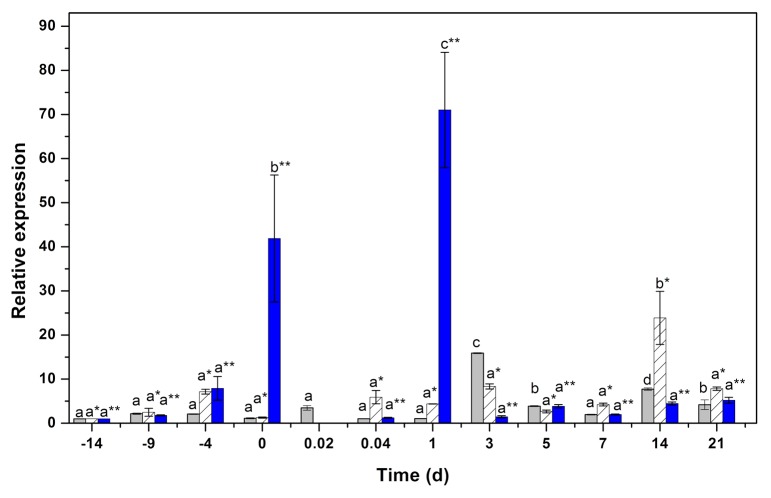
Figure 5. qPCR analysis for the expression of the genes GH3.1 (gray bars), GH3.6 (hatched bars) and GH3.17 (blue bars). One hundred mg of tissue was collected from the beginning of the preincubation of the plantlets (days –14, –9, and –4) to the induction day (day zero). Samples were collected also 0.02, 0.041, 1, 3, 5, 7, 14, and 21 d after the induction of SE. Samples were analyzed as described in Materials and Methods. All the analyses were performed with 3 biological replicates from at least 2 independent experiments. Error bars represent the standard error (n = 3). Different letters in symbols represent the statistical significance of mean differences between each determination at a given time according to the Tukey test (P ≤ 0.01).

An official website of the United States government
Here's how you know
Official websites use .gov
A
.gov website belongs to an official
government organization in the United States.
Secure .gov websites use HTTPS
A lock (
) or https:// means you've safely
connected to the .gov website. Share sensitive
information only on official, secure websites.
