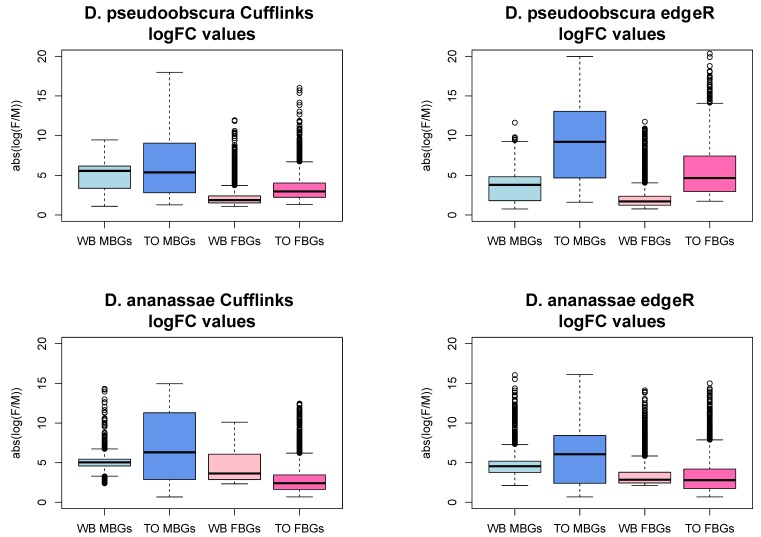
Figure S1.
Testis versus ovary comparisons result in significantly greater magnitudes of fold change relative to whole body comparisons. WB = whole body comparison, TO = testis-ovary comparison, MBGs = male-biased genes, FBGs = female-biased genes, logFC = log fold change (female / male). The y- axis is the absolute value of the ratio of normalized expression values of female whole body to male whole body or ovary to testis. TO logFCs are significantly higher than their WB counterparts in every case (t-test, p-value < 2.2e-16), except D. ananassae WB FBGs show greater logFCs (Cuffdiff: P<2.2e-16; edgeR: P=3.7e-09).

