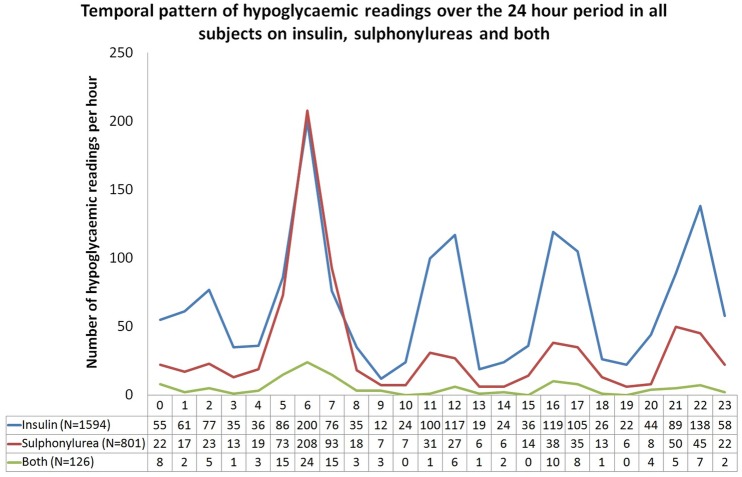
Figure 2.
Temporal patterns of hypoglycaemic readings over the 24 h period in all participants on insulin, sulfonylureas and both. The x axis represents the time period, for example, 0 represents the time period between 00:00 and 00:59, 1 represents the time period between 01:00 and 01:59, etc. The y axis represents the number of hypoglycaemic readings occurring in that time period. The figure demonstrates that the highest frequency occurs between 05:00 and 07:59 for both insulin and sulfonylurea therapies.

