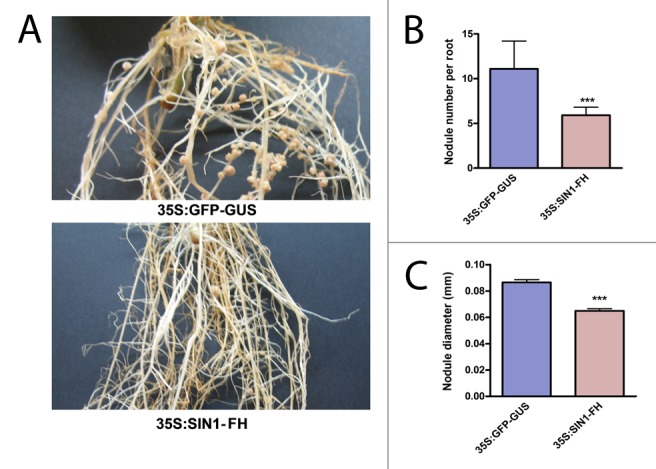
Figure 2. Overexpression of SIN1 resulted in the reduction of the number and size of root nodules. (A) Representative pictures illustrating the reduced nodule density and size found in 35S:SIN1-FH (FLAG-HIS) roots (upper panel) as compared with the control roots 35S:GFP-GUS (lower panel) at 17 dpi with R. etli. The complete open reading frame of SIN1 was cloned in the p35S:FH vector.28 Nodule number per root (B) and nodule size (C) developed in 35S:GFP-GUS or 35S:SIN1-FH roots at 17 dpi with R. etli. Error bars represent the SEM. Asterisks indicate significant differences with the control in an unpaired two-tailed t test with P < 0.001.
