
Table 5.
The Presentation of SHT according to US Finding
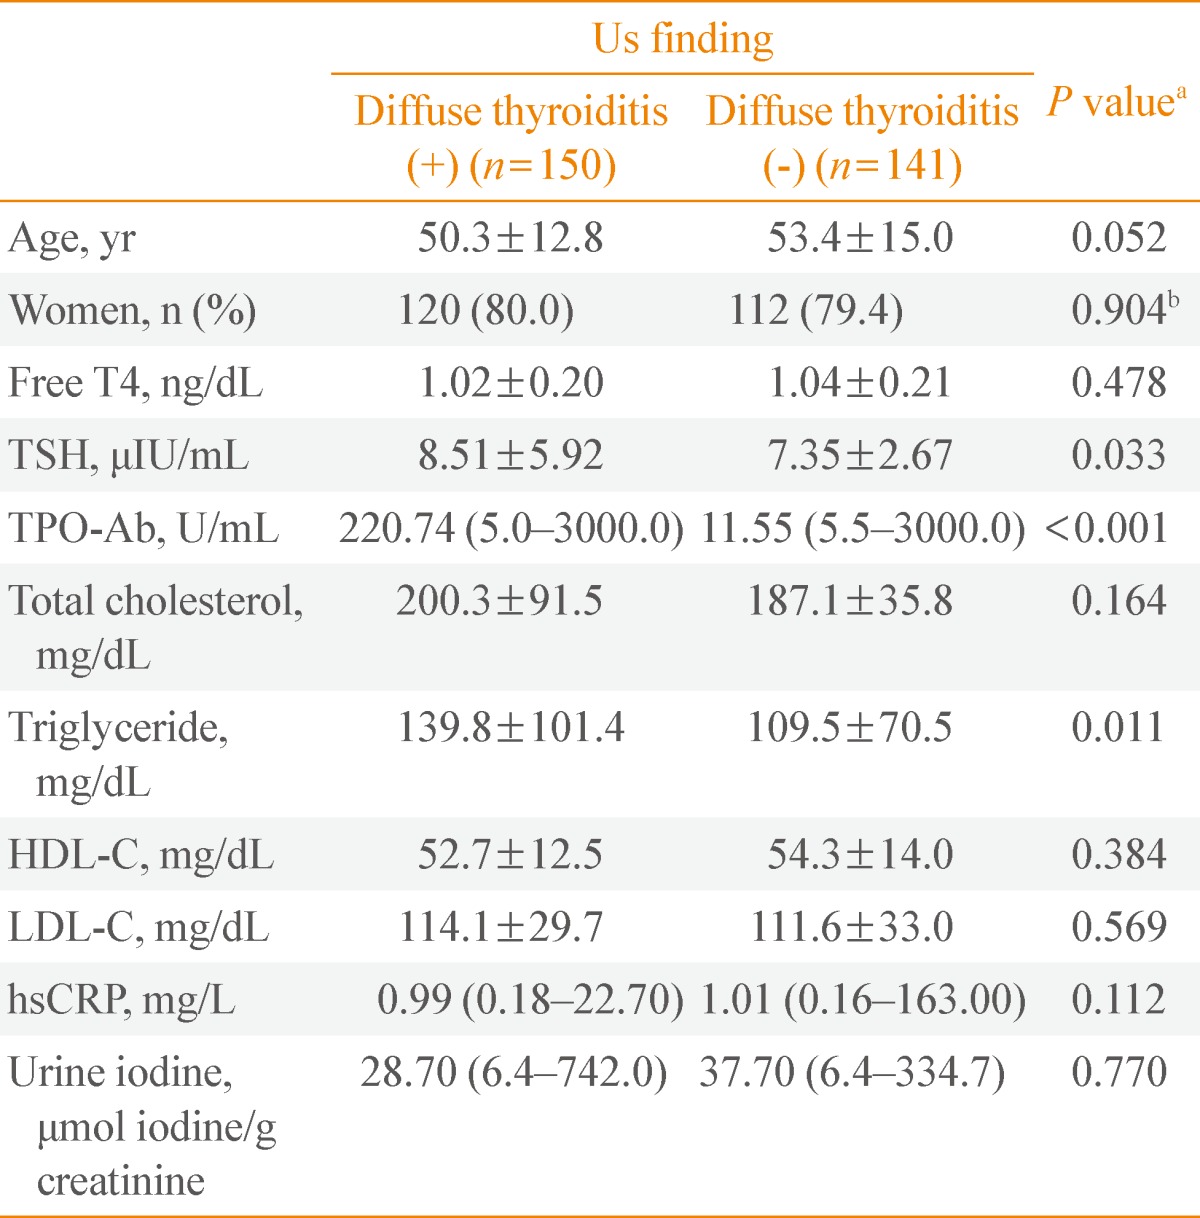
Data are mean±standard deviation, number (%) or median (minimum-maximum).
SHT, subclinical hypothyroidism; US, ultrasohographic; TSH, thyroid-stimulating hormone; TPO-Ab, anti-thyroid peroxidase antibody; HDL-C, high density lipoprotein cholesterol; LDL-C, low density lipoprotein cholesterol; hsCRP, high-sensitivity C-reactive protein.
aP values for the comparison of the mean values of two groups by using t test; bP values for the comparison of the Sex ratio of two groups by using Pearson's chi-square test.