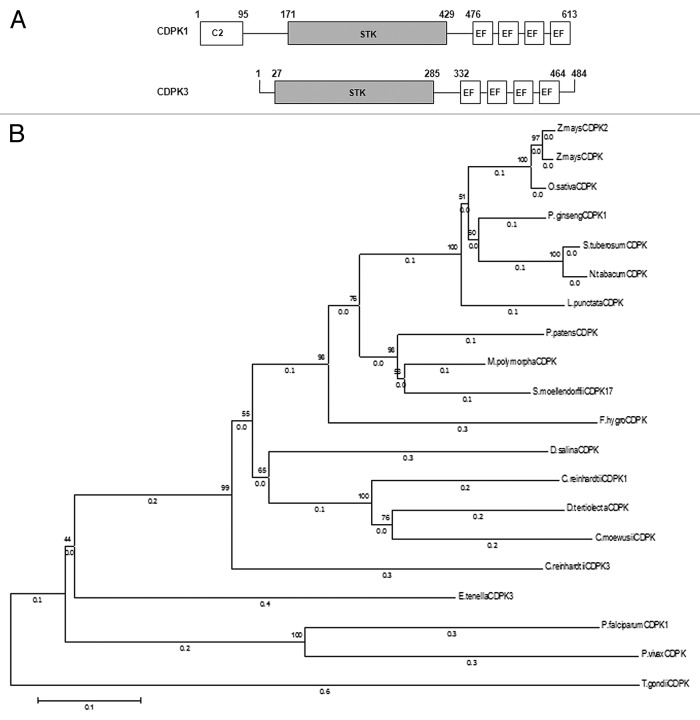
Figure 1. CDPKs from Chlamydomonas reinhardtii. (A) Schematic diagram of CDPK1 and CDPK3 showing the C2 domain from 1–95 aa in CDPK1, protein kinase catalytic domains (STK), and the 4 EF hands in both the CDPKs. (B) Phylogenetic relationship between C. reinhardtii CDPK1, CDPK3, and other CDPKs from algae, moss, higher plants, and apicomplexans. The phylogenetic tree was inferred using the Neighbor-Joining method. The optimal tree with the sum of branch length = 4.60159844 is shown. The percentage of replicate trees in which the associated taxa clustered together in the bootstrap test (1000 replicates) are shown next to the branches. The tree is drawn to scale, with branch lengths (next to the branches) in the same units as those of the evolutionary distances used to infer the phylogenetic tree. The evolutionary distances were computed using the Poisson correction method and are in the units of the number of amino acid substitutions per site. The analysis involved 20 amino acid sequences. All positions containing gaps and missing data were eliminated. There were a total of 371 positions in the final data set. Evolutionary analyses were conducted in MEGA6.

An official website of the United States government
Here's how you know
Official websites use .gov
A
.gov website belongs to an official
government organization in the United States.
Secure .gov websites use HTTPS
A lock (
) or https:// means you've safely
connected to the .gov website. Share sensitive
information only on official, secure websites.
