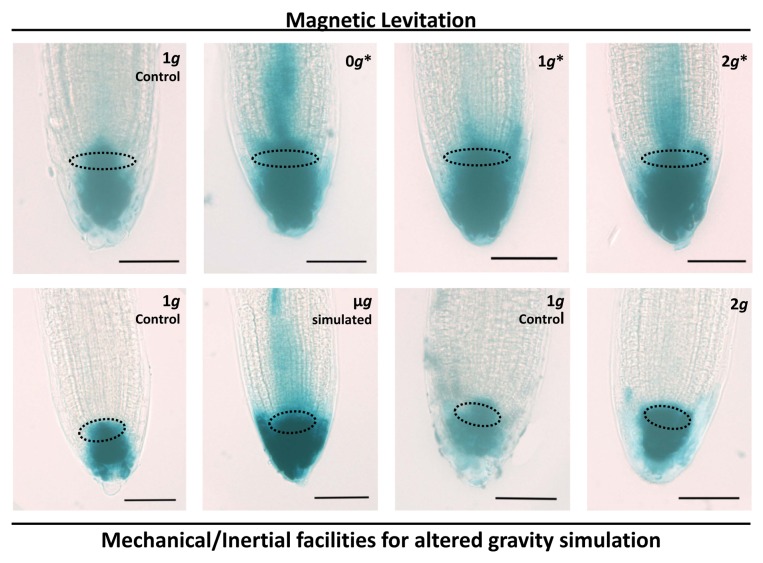
Figure 1. Auxin distribution in root tips revealed by GUS staining. The use of the reporter gene line DR5::GUS allowed the microscopical visualization of the auxin distribution. Whole mount preparation of roots were stained and observed by light microscopy. In the upper row, microscopical images of DR5::GUS-stained root meristems from seedlings grown for 4 d in the magnetic levitation facilities;12 From left to right: samples from the 1g external control, 0g*, 1g*, and 2g* positions in the magnet. In the lower row, the same approach was used in experiments using mechanical/inertial facilities for altered gravity simulation. From left to right: samples from the 1g external control and samples grown under simulated microgravity in the Random Positioning Machine (RPM), followed by the 1g external control and samples grown under hypergravity (2g) in the long-diameter centrifuge (LDC).13 The GUS staining shows the distribution of auxin in the root tip. The area limited by dotted lines in each image corresponds to the quiescent center. Two patterns of staining can be distinguished in the images: the first one comprises the quiescent center and the columella and can be found in images corresponding to 1g controls and in the 2g LDC-grown sample. The second pattern shows the same stained areas, but the staining extends to the whole root tip, including at least a part of the root meristem, with a faint extension toward the central cylinder of the root. These patterns have been described in the literature as corresponding, respectively, to normal and drug-inhibited polar auxin transport.14 Bars indicate 50 µm.

An official website of the United States government
Here's how you know
Official websites use .gov
A
.gov website belongs to an official
government organization in the United States.
Secure .gov websites use HTTPS
A lock (
) or https:// means you've safely
connected to the .gov website. Share sensitive
information only on official, secure websites.
