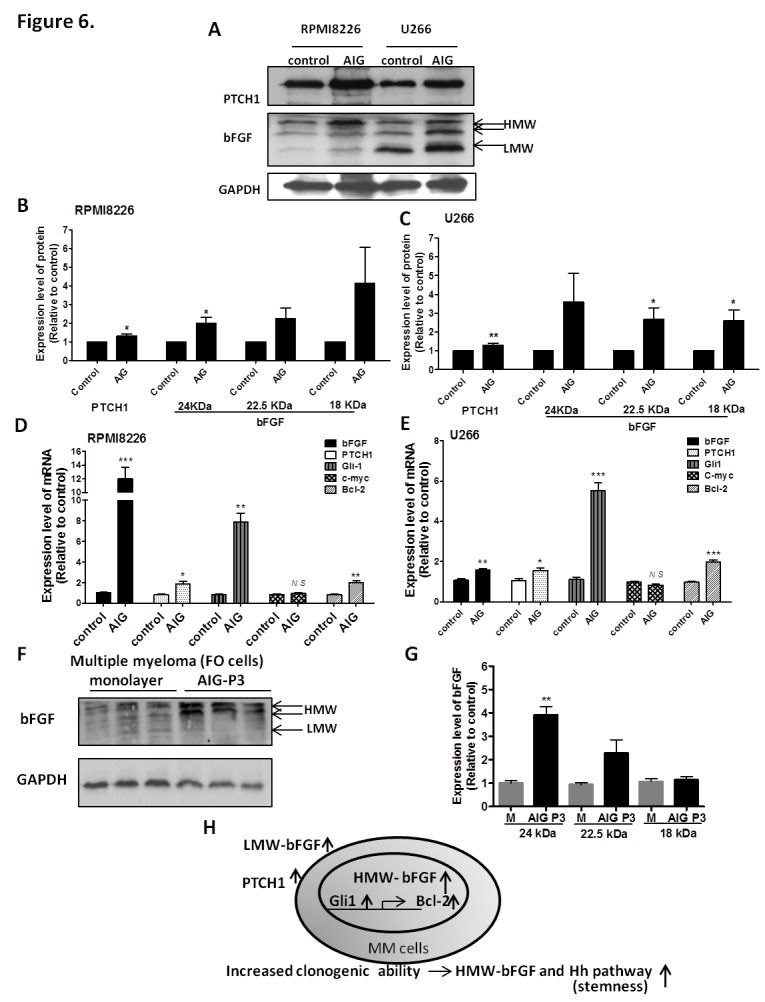
Figure 6. Expression of bFGF increases concurrent with PTCH1 upon AIG cultivation and passage in MM cells.

(A) Protein extracts from RPMI8226 and U266 cells with AIG were subjected to western blot analysis for bFGF and PTCH1, with GAPDH as the internal control. (B, C) Quantification of bFGF protein levels in RPMI8226 cells by western blot and U266. (D, E) The mRNA expression of bFGF, PTCH1, Gli1, C-myc and Bcl-2 in clonogenic-RPMI8226 and U266 cells. (F) Protein extracts from FO cells with AIG were subjected to western blot analysis of bFGF. (G) Quantification results of Western blot. Data were collected from three independent experiments, with each experiment repeated six times. The results were expressed as the relative index of control or monolayer control ± S.E.M. (*, P< 0.05, **, P< 0.01, ***, P< 0.001, Student's t-test). (H) The model of our hypothesis shows potential mechanisms by which HMW-bFGF and Hedgehog pathway maintains myeloma stem cell features.
