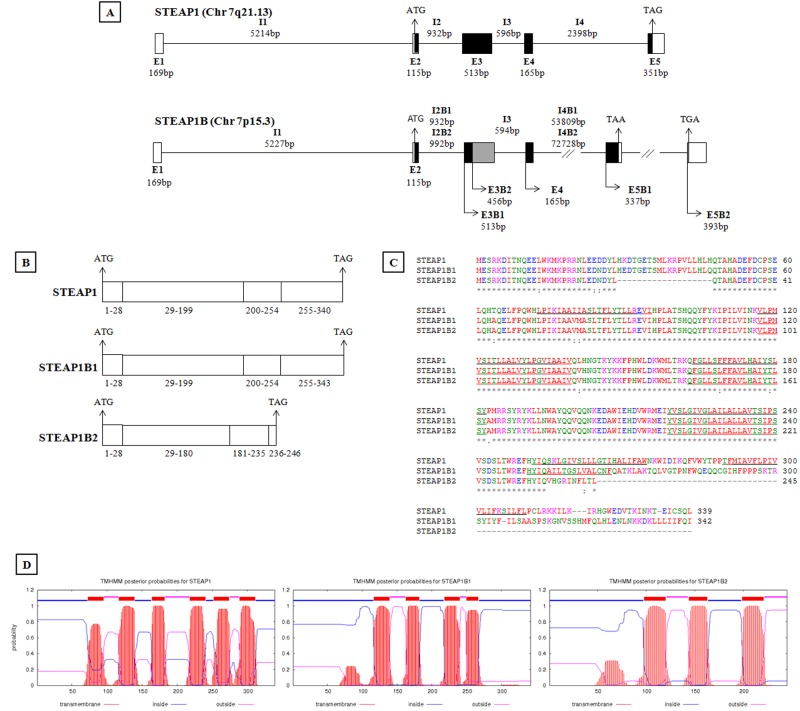
Figure 1. In silico analysis of human STEAP1 and STEAP1B gene.
Genomic organization (A) and transcripts (B) resulting from STEAP1 and STEAP1B gene. Exons (E), Introns (I) and their molecular sizes in bp (base pairs) are indicated. The sequence ATG and TAG/TAA corresponds to initiation and STOP codons, respectively. White boxes indicate non-coding exons, and black or grey boxes represent regions of coding exons depending on transcript encoded by STEAP1B gene. C- Alignment of amino acids sequences of STEAP1 and putative STEAP1B isoforms. The underlined amino acids sequences correspond to predicted transmembrane regions. * indicate identical amino acids among STEAP1s proteins; “:” indicate different amino acids but with similar physical-chemistry properties. D- Prediction of transmembrane helices in STEAP1, STEAP1B1 and STEAP1B2 proteins. All sequences were retrieved from http://genome.ucsc.edu/ and the alignment was carried out using Clustal Omega (https://www.ebi.ac.uk/Tools/msa/clustalo/). The prediction of transmembrane helices was performed resorting to Center for Biological Sequence analysis (http://www.cbs.dtu.dk/services/TMHMM/).

