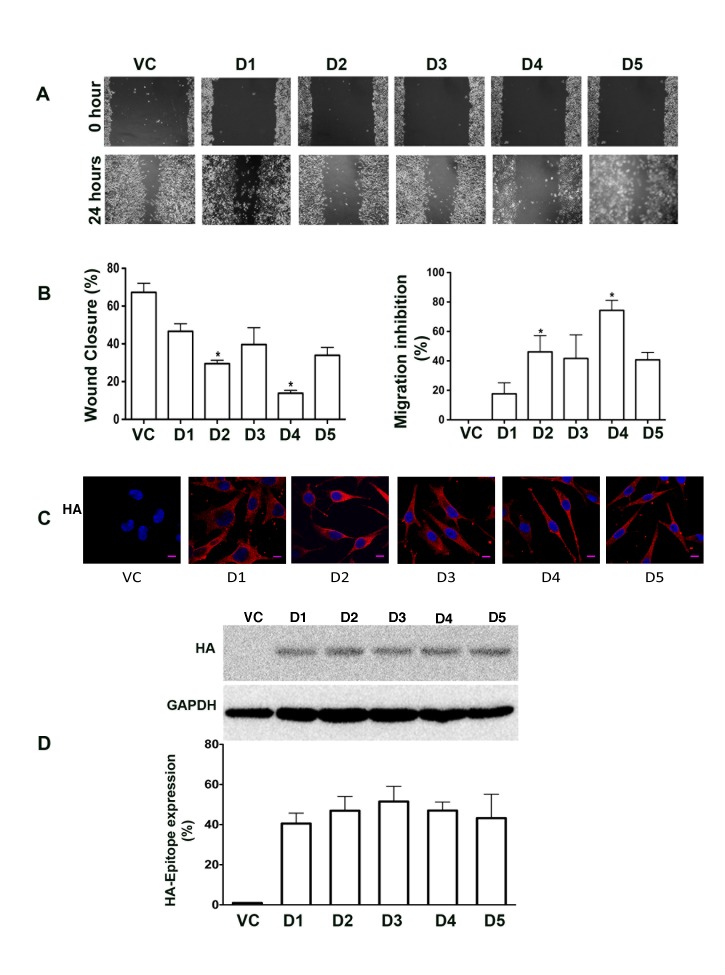
Figure 5. Expression of Rac1-interacting domains of Hax-1 inhibits the migration of SKOV3.
(A) SKOV3 control cells transfected with the empty pcDNA3.1+ vector (VC) and SKOV3 cells transiently transfected with HA-epitope tagged domains of Hax-1, Hax-D1, Hax-D2, Hax-D3, Hax-D4, and Hax-D5 (denoted as D1, D2, D3, D4, and D5 respectively), were utilized to analyze the role of Hax-1 domains on cell migration. At 24 hours after transfection, 0.5 μM Mitomycin-C was added to the transfectants (5×10⁵/dish) to prevent cell division. Linear scratch wounds were made with 200 μl pipette tips across the monolayer of cells in the respective dishes to initiate the wound-healing assay. At 0 hour, fields of view (10X) were selected at random, photographed and marked for re-identification. The identical fields were re-imaged after 24 hours of incubation. The images presented are representative of three independent experiments, each performed with triplicate fields of view. (B) Percentage of wound closure and the migration inhibition percentage were calculated based on the migration of the transfectants expressing vector control and the respective domains. The statistical significance was assessed using students-t test. * p<0.05. Error bars are presented as mean ± SEM for triplicate experiments. (C) Expression of the respective Hax-1 domains was monitored by immunostaining with HA-epitope antibody. Three different fields were viewed and three independent experiments were performed. Fluorescent micrographs were collected with a Leica SP2 MP Confocal microscope using 63x Plan APO 1.4 NA oil immersion objective. The results presented here are from a typical experiment and the scale bar is 10 μm for all the images. (D) Expression of HA-tagged Hax-D1-D5 domains (labeled as D1, D2, D3, D4, D5) were monitored along with vector control (VC) by immunoblot analysis using lysates (50 μg) derived from the respective transfectants. Lysates were resolved in 15% SDS-PAGE gels and immunoblotted with an antibody against HA-epitope. The blot was stripped and reprobed with GAPDH antibody to monitor equal loading of protein. The HA-epitope reactive bands were quantified and plotted as percent expression over GAPDH levels (mean ± SEM; n = 3).

